A tumour suppressor network relying on the polyamine-hypusine axis - PubMed (original) (raw)
. 2012 Jul 12;487(7406):244-8.
doi: 10.1038/nature11126.
Cornelius Miething, Lisa Lindqvist, José Reyes, Cristian Ruse, Iris Appelmann, Seungtai Yoon, Alexander Krasnitz, Julie Teruya-Feldstein, Darryl Pappin, Jerry Pelletier, Scott W Lowe
Affiliations
- PMID: 22722845
- PMCID: PMC3530829
- DOI: 10.1038/nature11126
A tumour suppressor network relying on the polyamine-hypusine axis
Claudio Scuoppo et al. Nature. 2012.
Abstract
Tumour suppressor genes encode a broad class of molecules whose mutational attenuation contributes to malignant progression. In the canonical situation, the tumour suppressor is completely inactivated through a two-hit process involving a point mutation in one allele and chromosomal deletion of the other. Here, to identify tumour suppressor genes in lymphoma, we screen a short hairpin RNA library targeting genes deleted in human lymphomas. We functionally identify those genes whose suppression promotes tumorigenesis in a mouse lymphoma model. Of the nine tumour suppressors we identified, eight correspond to genes occurring in three physically linked 'clusters', suggesting that the common occurrence of large chromosomal deletions in human tumours reflects selective pressure to attenuate multiple genes. Among the new tumour suppressors are adenosylmethionine decarboxylase 1 (AMD1) and eukaryotic translation initiation factor 5A (eIF5A), two genes associated with hypusine, a unique amino acid produced as a product of polyamine metabolism through a highly conserved pathway. Through a secondary screen surveying the impact of all polyamine enzymes on tumorigenesis, we establish the polyamine-hypusine axis as a new tumour suppressor network regulating apoptosis. Unexpectedly, heterozygous deletions encompassing AMD1 and eIF5A often occur together in human lymphomas and co-suppression of both genes promotes lymphomagenesis in mice. Thus, some tumour suppressor functions can be disabled through a two-step process targeting different genes acting in the same pathway.
Figures
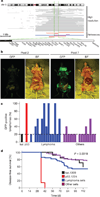
Figure 1. An in vivo shRNA screen for tumour suppressors in lymphoma
a, Screening interval for the 6q21 deletion. Top, high-resolution data from samples from patients. Bottom, 6q21 deletions as reported in the following references: orange; violet; blue; red. The dotted green lines delimit the target interval. Representative genes are shown. b, Brightfield (BF) and GFP whole-body imaging of mice from lymphoma pools 2 and 7. c, GFP-positive lymphomas observed for mice transplanted with shRNA sets targeting genes deleted in lymphoma (blue) or in other cancers (violet). Luciferase (luc, black) and p53 (red) were used as negative and positive controls. The dotted line represents the threshold for sequencing lymphoma. Each bar represents a pool. d, Survival curves for mice transplanted with neutral control (luc.1309, black, n = 100), positive control (p53.1224, n = 100), lymphoma sets (blue, n = 70) and other sets (violet, n = 75).
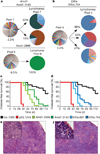
Figure 2. Validation of eIF5A and Amd1 as tumour suppressors in lymphoma
The distribution of shRNAs targeting Amd1 (a) or Eif5a (b) in lymphomas is compared with the corresponding pools. Percentages indicate the frequency of the shRNA in the pool and in the lymphomas. Survival curves for mice reconstituted with two shRNAs targeting Amd1 (c, n = 30 for each shRNA, P < 0.001 for both shRNAs) or Eif5a (d, n = 30 each shRNA, P < 0.001 for both shRNAs). Controls are p53.1224 (red, n = 30, P < 0.001) and luc.1309 (black, n = 30). Haematoxylin and eosin sections of spleens from mice transplanted with shRNA targeting Amd1 (e) or Eif5a (f). Disruption of tissue architecture is visible both in the spleen and lymph nodes. Scale bars, 50 µm; insets, 5 µm.
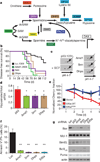
Figure 3. Biosynthesis of hypusine as a tumour suppressor pathway
a, Schematic of the polyamine–hypusine pathway. Enzymes and compounds are indicated as follows: ODC1, ornithine decarboxylase; SRM, spermidine synthase; SMS, spermine synthase; DHPS, deoxyhypusine synthase; DOHH, deoxyhypusine hydrolase; SMO(X), spermine oxidase; PAOX, polyamine oxidase; SSAT, spermidine–spermine acetyltransferase; DAX, diamine transporter. SAM, S-adenosylmethionine; dc-SAM, decarboxylated S-adenosylmethionine. The SSAT–PAOX axis can also convert spermidine to putrescine (not shown). b, Survival curves for mice (n = 10 per pool) transduced with the following shRNAs or shRNA pools: Srm (violet, P < 0.001), Dhps (blue, P < 0.001), Amd1 (Amd1.2606, green, P < 0.001) and control (luc.1309, black). c, Two-dimensional PAGE followed by eIF5A immunoblotting of lymphomas driven by the indicated shRNAs. The p53.1224 lymphomas were treated with 10 µM N1-guanyl-1,7-diaminoheptane (GC-7) in short-term culture conditions. Arrows indicate the hypusinated form. d, Quantification of hypusinated/total eIF5A ratio for the indicated shRNAs (n = 3 per group, *P < 0.05). Error bars, s.d. e, Lymphomas generated by transduction of Eif5a shRNAs were retrovirally transduced with control vector (black), a complementary DNA encoding wild-type Eif5a (red) or a mutant complementary DNA that cannot be hypusinated because of the substitution of the modified lysine (K50A, blue). Cherry percentages were monitored for 5 days and normalized to the Cherry fraction at day 1 (100). Error bars, s.d. (n = 4 for each time point, *P < 0.05). f, Annexin V+/PI− fractions of GFP-positive B cells 3 weeks after adoptive transplant of Eμ-myc HSPCs transduced with the indicated shRNAs or shRNA pools (n = 3 per each shRNA; **P < 0.01). Error bars, s.d. g, Western blot analysis for expression of the indicated proteins in Eμ-myc pre-malignant B cells transduced with the indicated shRNAs and sorted 21 days after transplant. Cells from three mice were pooled for each shRNA.
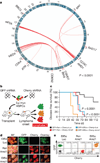
Figure 4. Loss of eIF5A andAMD1 cooperate in lymphoma progression
a, Deletions of eIF5A (17p) and AMD1 (6q21) are significantly associated in human lymphoma. Red lines identify significant pairwise co-deletion frequency for the indicated genomic regions. Representative tumour suppressors are shown. b, Outline of the two-colour in vivo cooperation assay. c, Survival curves for the following shRNA combinations: GFP–Ren + Cherry–Luc (n = 10, black); GFP–Eif5a + Cherry–Luc (n = 15, blue); GFP–Ren + Cherry-Amd1 (n = 15, red); GFP–Eif5a + Cherry–Amd (n = 20, orange). P values refer to Mantel–Cox tests of the Eif5a–Amd1 knockdown versus Eif5a + Luc or Ren + Amd1. Bright-field (BF), GFP and Cherry imaging (d) and flow cytometry (e) for the indicated shRNA combinations. The first shRNA was tagged with GFP, the second with Cherry.
Comment in
- At the hypusine of the crime.
Burgess DJ. Burgess DJ. Nat Rev Cancer. 2012 Jul 5;12(8):509. doi: 10.1038/nrc3325. Nat Rev Cancer. 2012. PMID: 22763665 No abstract available.
Similar articles
- Genetic analyses of Myc and hypusine circuits in tumorigenesis.
Nakanishi S, Cleveland JL. Nakanishi S, et al. Methods Enzymol. 2025;715:1-17. doi: 10.1016/bs.mie.2025.02.005. Epub 2025 Mar 21. Methods Enzymol. 2025. PMID: 40382132 - Hypusine, a polyamine-derived amino acid critical for eukaryotic translation.
Park MH, Wolff EC. Park MH, et al. J Biol Chem. 2018 Nov 30;293(48):18710-18718. doi: 10.1074/jbc.TM118.003341. Epub 2018 Sep 26. J Biol Chem. 2018. PMID: 30257869 Free PMC article. Review. - Targeting the polyamine-hypusine circuit for the prevention and treatment of cancer.
Nakanishi S, Cleveland JL. Nakanishi S, et al. Amino Acids. 2016 Oct;48(10):2353-62. doi: 10.1007/s00726-016-2275-3. Epub 2016 Jun 29. Amino Acids. 2016. PMID: 27357307 Free PMC article. Review. - Neuronal growth and survival mediated by eIF5A, a polyamine-modified translation initiation factor.
Huang Y, Higginson DS, Hester L, Park MH, Snyder SH. Huang Y, et al. Proc Natl Acad Sci U S A. 2007 Mar 6;104(10):4194-9. doi: 10.1073/pnas.0611609104. Epub 2007 Feb 28. Proc Natl Acad Sci U S A. 2007. PMID: 17360499 Free PMC article.
Cited by
- COX-2/PGE2 upregulation contributes to the chromosome 17p-deleted lymphoma.
Qi L, Pan X, Chen X, Liu P, Chen M, Zhang Q, Hang X, Tang M, Wen D, Dai L, Chen C, Liu Y, Xu Z. Qi L, et al. Oncogenesis. 2023 Feb 7;12(1):5. doi: 10.1038/s41389-023-00451-9. Oncogenesis. 2023. PMID: 36750552 Free PMC article. - Down-regulation of MYH10 driven by chromosome 17p13.1 deletion promotes hepatocellular carcinoma metastasis through activation of the EGFR pathway.
Jin Q, Cheng M, Xia X, Han Y, Zhang J, Cao P, Zhou G. Jin Q, et al. J Cell Mol Med. 2021 Dec;25(24):11142-11156. doi: 10.1111/jcmm.17036. Epub 2021 Nov 4. J Cell Mol Med. 2021. PMID: 34738311 Free PMC article. - Role of p38 and JNK MAPK signaling pathways and tumor suppressor p53 on induction of apoptosis in response to Ad-eIF5A1 in A549 lung cancer cells.
Taylor CA, Zheng Q, Liu Z, Thompson JE. Taylor CA, et al. Mol Cancer. 2013 May 2;12:35. doi: 10.1186/1476-4598-12-35. Mol Cancer. 2013. PMID: 23638878 Free PMC article. - Inducible Genome Editing with Conditional CRISPR/Cas9 Mice.
Katigbak A, Robert F, Paquet M, Pelletier J. Katigbak A, et al. G3 (Bethesda). 2018 May 4;8(5):1627-1635. doi: 10.1534/g3.117.300327. G3 (Bethesda). 2018. PMID: 29519936 Free PMC article. - Deletions linked to TP53 loss drive cancer through p53-independent mechanisms.
Liu Y, Chen C, Xu Z, Scuoppo C, Rillahan CD, Gao J, Spitzer B, Bosbach B, Kastenhuber ER, Baslan T, Ackermann S, Cheng L, Wang Q, Niu T, Schultz N, Levine RL, Mills AA, Lowe SW. Liu Y, et al. Nature. 2016 Mar 24;531(7595):471-475. doi: 10.1038/nature17157. Epub 2016 Mar 16. Nature. 2016. PMID: 26982726 Free PMC article.
References
- Knudson AG. Cancer genetics. Am. J. Med. Genet. 2002;111:96–102. - PubMed
- Berger AH, Pandolfi PP. Haplo-insufficiency: a driving force in cancer. J. Pathol. 2011;223:137–146. - PubMed
Publication types
MeSH terms
Substances
Grants and funding
- CA087497/CA/NCI NIH HHS/United States
- RC2 CA148532/CA/NCI NIH HHS/United States
- CA148532/CA/NCI NIH HHS/United States
- HHMI/Howard Hughes Medical Institute/United States
- P01 CA087497/CA/NCI NIH HHS/United States
- P01 CA013106/CA/NCI NIH HHS/United States
- MOP-106530/CAPMC/ CIHR/Canada
LinkOut - more resources
Full Text Sources
Other Literature Sources
Molecular Biology Databases


