A total-evidence approach to dating with fossils, applied to the early radiation of the hymenoptera - PubMed (original) (raw)
A total-evidence approach to dating with fossils, applied to the early radiation of the hymenoptera
Fredrik Ronquist et al. Syst Biol. 2012.
Abstract
Phylogenies are usually dated by calibrating interior nodes against the fossil record. This relies on indirect methods that, in the worst case, misrepresent the fossil information. Here, we contrast such node dating with an approach that includes fossils along with the extant taxa in a Bayesian total-evidence analysis. As a test case, we focus on the early radiation of the Hymenoptera, mostly documented by poorly preserved impression fossils that are difficult to place phylogenetically. Specifically, we compare node dating using nine calibration points derived from the fossil record with total-evidence dating based on 343 morphological characters scored for 45 fossil (4--20 complete) and 68 extant taxa. In both cases we use molecular data from seven markers (∼5 kb) for the extant taxa. Because it is difficult to model speciation, extinction, sampling, and fossil preservation realistically, we develop a simple uniform prior for clock trees with fossils, and we use relaxed clock models to accommodate rate variation across the tree. Despite considerable uncertainty in the placement of most fossils, we find that they contribute significantly to the estimation of divergence times in the total-evidence analysis. In particular, the posterior distributions on divergence times are less sensitive to prior assumptions and tend to be more precise than in node dating. The total-evidence analysis also shows that four of the seven Hymenoptera calibration points used in node dating are likely to be based on erroneous or doubtful assumptions about the fossil placement. With respect to the early radiation of Hymenoptera, our results suggest that the crown group dates back to the Carboniferous, ∼309 Ma (95% interval: 291--347 Ma), and diversified into major extant lineages much earlier than previously thought, well before the Triassic. [Bayesian inference; fossil dating; morphological evolution; relaxed clock; statistical phylogenetics.].
Figures
Figure 1.
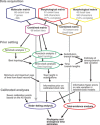
Flow-chart showing the main analyses conducted in this study. See Materials and Methods section for details, explanations, and justifications for the different steps.
Figure 2.
Finding suitable prior parameters for relaxed-clock models. a) Relationship between branch lengths estimated under a strict-clock and under a nonclock model. The outlier corresponds to the branch leading to Xyelidae. b) Increase in variance (squared deviation from the expectation) of nonclock branch lengths over time. The slope of the regression line was used directly to center the prior for the variance increase parameter of the IGR model, and via simulations for the TK02 (Thorne–Kishino 2002) anc CPP models. c) Outcome of the simulations under the CPP model showing success of different combinations of the variance of the rate multiplier and the rate of the Poisson process to approximate the observed variance in branch lengths. Colors (in the online version of this figure) represent the relative deviation from the observed variance. The results were used to choose appropriate priors. d) The rate ratios observed in random pairs of branches tend to be higher than the ratios between parent and offspring pairs, demonstrating slight but significant rate autocorrelation in the data set (_P_=0.0055; Kolmogorov–Smirnov test of equality of distributions). The bars on the random pairs represent SDs obtained from 1000 replicates of random pair sets of the same size as the parent–offspring pair set.
Figure 3.
Phylogeny of extant Hymenoptera and outgroups retrieved under a nonclock model. Branch colors indicate the families of symphytans (the basal grade of Hymenoptera) included in the analysis. Capital letters followed by a star show the nine calibration points used in the calibrated analyses (Table 2). Values above nodes indicate Bayesian posterior probabilities.
Figure 4.
Extensive simulations were used to validate the MCMC algorithms. Here we show a simple example: retrieval of the uniform clock tree prior for a tree with four extant taxa a and c) and a tree with two extant taxa and two extinct taxa b and d). The age of the tree root was fixed to 1.0 in both cases, and the age of the fossils to 0.5. Both tree probabilities a and c) and branch length distributions b and d; only part shown in d) closely match analytically derived values. The results shown are for the strict-clock model; similar results were obtained under all relaxed-clock models.
Figure 5.
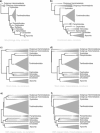
Clock model and rooting assumption had a large effect on tree topology. When a clock was not assumed, the morphological a), molecular (not shown), and combined morphological and molecular b) trees were virtually congruent and agreed well with previous studies. c) Under the strict-clock model, however, the topology changed dramatically. d) Enforcing Holometabola to be monophyletic did not change hymenopteran relationships in the strict-clock analysis. e) The relaxed-clock models (here IGR) also produced apparent topological artifacts close to the root of the tree. f) When aided by a rooting constraint (Holometabola monophyletic), however, the relaxed-clock models (here IGR) retrieved the expected topology. The widths of clades are proportional to their representation in our data set, not to their true diversity. Only extant taxa were included in the analyses shown here.
Figure 6.
Different relaxed-clock models result in different relative divergence time estimates (uncalibrated trees). a) Tree with branches colored according to their substitution rate as estimated under the IGR relaxed-clock model. The letters denote the branches examined in plots c–f, respectively. b) As previous, but under the CPP relaxed-clock model. c–f) Length of the four branches indicated in Figure 5a as estimated under different clock and nonclock models. For the relaxed-clock models, we plotted both the time length (in expected substitutions per site at the base rate of the clock) and the corresponding effective branch length, which equals the time length times the rate estimated for that branch (see labels in Fig. 5d). Note that effective branch lengths tend to be very similar to nonclock branch lengths, while time length distributions vary more across relaxed-clock models and tend to be less precise.
Figure 7.
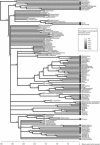
Majority-rule consensus tree from a total-evidence analysis including all fossils (IGR model). The tree is poorly resolved, which reflects the uncertainty in fossil placement. The underlying consensus tree of extant taxa is virtually identical to trees obtained in analyses without fossils (see Figs. 7 and 8). Grey-scale boxes indicate the percentage of morphological characters that were coded for each taxon, showing the incompleteness of the fossils. Values above branches represent PPs.
Figure 8.
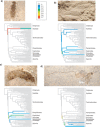
The uncertainty in phylogenetic placement varied considerably across fossils. We show the PPs of four example fossils attaching to specific branches on the majority rule consensus tree of the extant taxa (IGR model). (a) Mesoxyela mesozoica Rasnitsyn, 1965 (140 Ma). (b) Sogutia liassica Rasnitsyn, 1977 (190 Ma). (c) Aulisca odontura Rasnitsyn, 1968 (161 Ma). (d) Leptephialtities caudatus Rasnitsyn, 1975 (161 Ma). Results were similar under the CPP and TK02 models.
Figure 9.
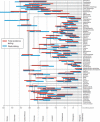
Comparison of node age estimates obtained using total-evidence dating (red in the online version, light gray in the print version) node dating (blue in the online version, dark gray in the print version) under the IGR model. The bars represent the 95% posterior credibility (highest posterior density) intervals for the age of each node, and are plotted on top of the extant consensus tree resulting from the total-evidence analysis. Two nodes in the Apocrita clade (lower part of tree) were differently resolved in the node-dating analysis, and the blue bars are therefore missing for these. Arrows indicate the direction and extent to which the median node age shifted from the total-evidence analysis to the node-calibration analysis.
Figure 10.
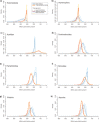
Posteriors obtained under node dating and total-evidence dating are compared across three different priors on tree age for eight nodes (a–h; cf. Table 2). The nodes correspond to the most recent common ancestor of the extant forms of the specified taxa. For the intermediate prior on tree age, we used an offset-exponential distribution with a minimum of 315 Ma (oldest neopteran fossil) and a mean of 396 Ma (oldest insect fossil). For the more and less restrictive prior, we shifted the mean to half and twice the distance to the minimum (355 Ma and 477 Ma), respectively. Note that the total-evidence posteriors are less sensitive to prior assumptions than node-dating posteriors. They also tend to be more precise; if not, the total-evidence analysis indicated that the calibration points were based on erroneous or doubtful assumptions about fossil placement, causing posteriors to be artificially truncated (c; probably also e and f).
Similar articles
- Total-Evidence Dating under the Fossilized Birth-Death Process.
Zhang C, Stadler T, Klopfstein S, Heath TA, Ronquist F. Zhang C, et al. Syst Biol. 2016 Mar;65(2):228-49. doi: 10.1093/sysbio/syv080. Epub 2015 Oct 22. Syst Biol. 2016. PMID: 26493827 Free PMC article. - Using more than the oldest fossils: dating osmundaceae with three Bayesian clock approaches.
Grimm GW, Kapli P, Bomfleur B, McLoughlin S, Renner SS. Grimm GW, et al. Syst Biol. 2015 May;64(3):396-405. doi: 10.1093/sysbio/syu108. Epub 2014 Dec 9. Syst Biol. 2015. PMID: 25503771 - Dating Tips for Divergence-Time Estimation.
O'Reilly JE, Dos Reis M, Donoghue PCJ. O'Reilly JE, et al. Trends Genet. 2015 Nov;31(11):637-650. doi: 10.1016/j.tig.2015.08.001. Epub 2015 Oct 1. Trends Genet. 2015. PMID: 26439502 Review. - Inferring the Total-Evidence Timescale of Marattialean Fern Evolution in the Face of Model Sensitivity.
May MR, Contreras DL, Sundue MA, Nagalingum NS, Looy CV, Rothfels CJ. May MR, et al. Syst Biol. 2021 Oct 13;70(6):1232-1255. doi: 10.1093/sysbio/syab020. Syst Biol. 2021. PMID: 33760075 Free PMC article. - The evolution of methods for establishing evolutionary timescales.
Donoghue PC, Yang Z. Donoghue PC, et al. Philos Trans R Soc Lond B Biol Sci. 2016 Jul 19;371(1699):20160020. doi: 10.1098/rstb.2016.0020. Philos Trans R Soc Lond B Biol Sci. 2016. PMID: 27325838 Free PMC article. Review.
Cited by
- Novel phylogenomic inference and 'Out of Asia' biogeography of cobras, coral snakes and their allies.
Weinell JL, Burbrink FT, Das S, Brown RM. Weinell JL, et al. R Soc Open Sci. 2024 Aug 7;11(8):240064. doi: 10.1098/rsos.240064. eCollection 2024 Aug. R Soc Open Sci. 2024. PMID: 39113776 Free PMC article. - Mitochondrial Genome Characteristics Reveal Evolution of Acanthopsetta nadeshnyi (Jordan and Starks, 1904) and Phylogenetic Relationships.
Yang LM, Xue JF, Zhao XM, Ding K, Liu ZW, Wang ZS, Chen JB, Huang YK. Yang LM, et al. Genes (Basel). 2024 Jul 8;15(7):893. doi: 10.3390/genes15070893. Genes (Basel). 2024. PMID: 39062672 Free PMC article. - Origin and Early Evolution of Hydrocharitaceae and the Ancestral Role of Stratiotes.
Ulrich S, Vieira M, Coiro M, Bouchal JM, Geier C, Jacobs BF, Currano ED, Lenz OK, Wilde V, Zetter R, Grímsson F. Ulrich S, et al. Plants (Basel). 2024 Mar 31;13(7):1008. doi: 10.3390/plants13071008. Plants (Basel). 2024. PMID: 38611537 Free PMC article. - Jurassic shuotheriids show earliest dental diversification of mammaliaforms.
Mao F, Li Z, Wang Z, Zhang C, Rich T, Vickers-Rich P, Meng J. Mao F, et al. Nature. 2024 Apr;628(8008):569-575. doi: 10.1038/s41586-024-07258-7. Epub 2024 Apr 3. Nature. 2024. PMID: 38570681 - Climatic and biogeographic processes underlying the diversification of the pantropical flowering plant family Annonaceae.
Li W, Wang R, Liu MF, Folk RA, Xue B, Saunders RMK. Li W, et al. Front Plant Sci. 2024 Mar 8;15:1287171. doi: 10.3389/fpls.2024.1287171. eCollection 2024. Front Plant Sci. 2024. PMID: 38525154 Free PMC article.
References
- Benton M.J., Ayala F.J. Dating the tree of life. Science. 2003;300:1698–1700. - PubMed
- Beutel R.G., Friedrich F., Hörnschemeyer T., Pohl H., Hünefeld F., Beckmann F., Meier R., Misof B., Whiting M.F., Vilhelmsen L. Morphological and molecular evidence converge upon a robust phylogeny of the megadiverse Holometabola. Cladistics. 2011;27:341–355. - PubMed
- Blanquart S., Lartillot N. A Bayesian compound stochastic process for modeling nonstationary and nonhomogeneous sequence evolution. Mol. Biol. E. 2006;23:2058–2071. - PubMed
- Blanquart S., Lartillot N. A site- and time-heterogeneous model of amino acid replacement. Mol. Biol. E. 2008;25:842–858. - PubMed
- Blum M., François O. Which random processes describe the tree of life? A large-scale study of phylogenetic tree imbalance. Syst. Biol. 2006;55:685–691. - PubMed
MeSH terms
LinkOut - more resources
Full Text Sources
Other Literature Sources
Molecular Biology Databases
Research Materials
