Activation of lateral habenula inputs to the ventral midbrain promotes behavioral avoidance - PubMed (original) (raw)
Activation of lateral habenula inputs to the ventral midbrain promotes behavioral avoidance
Alice M Stamatakis et al. Nat Neurosci. 2012.
Abstract
Lateral habenula (LHb) projections to the ventral midbrain, including the rostromedial tegmental nucleus (RMTg), convey negative reward-related information, but the behavioral ramifications of selective activation of this pathway remain unexplored. We found that exposure to aversive stimuli in mice increased LHb excitatory drive onto RMTg neurons. Furthermore, optogenetic activation of this pathway promoted active, passive and conditioned behavioral avoidance. Thus, activity of LHb efferents to the midbrain is aversive but can also serve to negatively reinforce behavioral responding.
Figures
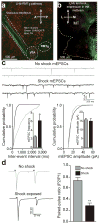
Figure 1. Acute unpredictable foot shock exposure enhances LHb-to-RMTg glutamate release
(a) Sagittal confocal image showing expression of ChR2-EYFP (green) in the LHb-to-midbrain pathway via the fasciculus retroflexus fiber bundle following injection of the viral construct into the LHb. Midbrain TH+ dopamine neurons are shown in blue. A, Anterior; P, Posterior; D, Dorsal, V, Ventral. (b) Horizontal confocal image showing the distribution of LHb terminals in the midbrain. M, medial; L, lateral. (c) Top: representative mEPSC traces recorded from neurons from mice immediately following either 0 or 19 unpredictable foot shocks. Bottom Left: Representative cumulative mEPSC inter-event interval probability plot. Inset: Average mEPSC frequency was significantly increased in neurons from shock exposed mice (t(13) = 2.88, p = 0.01). Bottom Right: Representative cumulative mEPSC amplitude probability plot. Inset: Average mEPSC amplitude was not altered in RMTg neurons from shock exposed mice (t(13) = 0.12, p = 0.91). (d) Left: Representative optically evoked paired-pulse ratios from LHb efferents onto RMTg neurons. Right: Average paired-pulse ratios showing that paired-pulse ratios at LHb-to-RMTg synapses were significantly depressed from mice that received foot shocks (t(14) = 3.56, p = 0.003). n = 8 cells/group. All error bars for all figures correspond to the s.e.m. * indicates p < 0.05 and ** indicates p < 0.01 for all figures.
Figure 2. Activation of LHb inputs to the RMTg produces behavioral avoidance
(a) Left: Real-time place preference location plots from two representative mice showing the animal’s position over the course of the 20-min session. Right: ChR2-EYFP-expressing mice spent significantly less time on the stimulated-paired side (t(10) = 7.90, p < 0.0001). n = 6 mice/group for real-time place preference. (b) ChR2-EYFP-expressing mice spent significantly less time in the stimulation-paired chamber compared to the non-stimulation-paired chamber 24 hrs after the last stimulation conditioning session (t(7) = 3.54, p = 0.01). EYFP-expressing did not show a preference (t(7) = 0.57, p = 0.58). (c) ChR2-EYFP-expressing mice spent significantly less time in the stimulation paired chamber compared to the non-stimulation-paired chamber 7 days after the last stimulation session (t(7) = 3.24, p = 0.01). EYFP-expressing mice did not show a preference (t(7) = 0.17, p = 0.86). n = 8 mice/group for conditioned place preference.
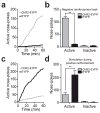
Figure 3. Activation of LHb inputs to the RMTg produces active behavioral avoidance and disrupts positive reinforcement
(a) Example cumulative records of active nose-pokes made by a ChR2-EYFP and an EYFP-expressing mouse to terminate LHb-to-RMTg optical activation. (b) Average number of active nose-pokes from one behavioral session in following training (> 4 days; t(10) = 20.52, p < 0.0001). There was no difference in inactive nose-pokes between the two groups (t(10) = 0.29, p = 0.78). n = 6 mice per group. (c) Example cumulative records of active nose-pokes made by a ChR2-EYFP and an EYFP-expressing mouse when optical stimulation was paired with the nose-poke to receive a sucrose reward. (d) Average number of active and inactive nose-pokes during positive reinforcement (t(14) = 4.01, p < 0.01). There was no difference in inactive nose-pokes between the two groups (t(14) = 1.22, p = 0.24). n = 8 mice per group.
Similar articles
- Habenula-Induced Inhibition of Midbrain Dopamine Neurons Is Diminished by Lesions of the Rostromedial Tegmental Nucleus.
Brown PL, Palacorolla H, Brady D, Riegger K, Elmer GI, Shepard PD. Brown PL, et al. J Neurosci. 2017 Jan 4;37(1):217-225. doi: 10.1523/JNEUROSCI.1353-16.2016. J Neurosci. 2017. PMID: 28053043 Free PMC article. - Functional evidence for a direct excitatory projection from the lateral habenula to the ventral tegmental area in the rat.
Brown PL, Shepard PD. Brown PL, et al. J Neurophysiol. 2016 Sep 1;116(3):1161-74. doi: 10.1152/jn.00305.2016. Epub 2016 Jun 29. J Neurophysiol. 2016. PMID: 27358317 Free PMC article. - Entopeduncular Nucleus Projections to the Lateral Habenula Contribute to Cocaine Avoidance.
Li H, Eid M, Pullmann D, Chao YS, Thomas AA, Jhou TC. Li H, et al. J Neurosci. 2021 Jan 13;41(2):298-306. doi: 10.1523/JNEUROSCI.0708-20.2020. Epub 2020 Nov 19. J Neurosci. 2021. PMID: 33214316 Free PMC article. - Ventral pallidal modulation of aversion processing.
Wulff AB, Tooley J, Marconi LJ, Creed MC. Wulff AB, et al. Brain Res. 2019 Jun 15;1713:62-69. doi: 10.1016/j.brainres.2018.10.010. Epub 2018 Oct 6. Brain Res. 2019. PMID: 30300634 Review. - The rostromedial tegmental (RMTg) "brake" on dopamine and behavior: A decade of progress but also much unfinished work.
Jhou TC. Jhou TC. Neuropharmacology. 2021 Oct 15;198:108763. doi: 10.1016/j.neuropharm.2021.108763. Epub 2021 Aug 22. Neuropharmacology. 2021. PMID: 34433088 Free PMC article. Review.
Cited by
- Tonic activity in lateral habenula neurons acts as a neutral valence brake on reward-seeking behavior.
Post RJ, Bulkin DA, Ebitz RB, Lee V, Han K, Warden MR. Post RJ, et al. Curr Biol. 2022 Oct 24;32(20):4325-4336.e5. doi: 10.1016/j.cub.2022.08.016. Epub 2022 Aug 31. Curr Biol. 2022. PMID: 36049479 Free PMC article. - Reward and aversion in a heterogeneous midbrain dopamine system.
Lammel S, Lim BK, Malenka RC. Lammel S, et al. Neuropharmacology. 2014 Jan;76 Pt B(0 0):351-9. doi: 10.1016/j.neuropharm.2013.03.019. Epub 2013 Apr 8. Neuropharmacology. 2014. PMID: 23578393 Free PMC article. Review. - Neuronal and synaptic adaptations underlying the benefits of deep brain stimulation for Parkinson's disease.
Xu W, Wang J, Li XN, Liang J, Song L, Wu Y, Liu Z, Sun B, Li WG. Xu W, et al. Transl Neurodegener. 2023 Nov 30;12(1):55. doi: 10.1186/s40035-023-00390-w. Transl Neurodegener. 2023. PMID: 38037124 Free PMC article. Review. - Mu Opioid Receptor Actions in the Lateral Habenula.
Margolis EB, Fields HL. Margolis EB, et al. PLoS One. 2016 Jul 18;11(7):e0159097. doi: 10.1371/journal.pone.0159097. eCollection 2016. PLoS One. 2016. PMID: 27427945 Free PMC article. - Generality and opponency of rostromedial tegmental (RMTg) roles in valence processing.
Li H, Pullmann D, Cho JY, Eid M, Jhou TC. Li H, et al. Elife. 2019 Jan 22;8:e41542. doi: 10.7554/eLife.41542. Elife. 2019. PMID: 30667358 Free PMC article.
References
- Schultz W, Dayan P, Montague PR. Science. 1997;275:1593–1599. - PubMed
Publication types
MeSH terms
Substances
Grants and funding
- DA029325/DA/NIDA NIH HHS/United States
- R21 DA029325/DA/NIDA NIH HHS/United States
- P30 NS045892/NS/NINDS NIH HHS/United States
- F31 DA034472/DA/NIDA NIH HHS/United States
- T32 NS007431/NS/NINDS NIH HHS/United States
- DA032750/DA/NIDA NIH HHS/United States
- R01 DA032750/DA/NIDA NIH HHS/United States
- R37 DA032750/DA/NIDA NIH HHS/United States
LinkOut - more resources
Full Text Sources
Other Literature Sources


