An overlapping protein-coding region in influenza A virus segment 3 modulates the host response - PubMed (original) (raw)
. 2012 Jul 13;337(6091):199-204.
doi: 10.1126/science.1222213. Epub 2012 Jun 28.
H M Wise, J C Kash, K-A Walters, N M Wills, Y-L Xiao, R L Dunfee, L M Schwartzman, A Ozinsky, G L Bell, R M Dalton, A Lo, S Efstathiou, J F Atkins, A E Firth, J K Taubenberger, P Digard
Affiliations
- PMID: 22745253
- PMCID: PMC3552242
- DOI: 10.1126/science.1222213
An overlapping protein-coding region in influenza A virus segment 3 modulates the host response
B W Jagger et al. Science. 2012.
Abstract
Influenza A virus (IAV) infection leads to variable and imperfectly understood pathogenicity. We report that segment 3 of the virus contains a second open reading frame ("X-ORF"), accessed via ribosomal frameshifting. The frameshift product, termed PA-X, comprises the endonuclease domain of the viral PA protein with a C-terminal domain encoded by the X-ORF and functions to repress cellular gene expression. PA-X also modulates IAV virulence in a mouse infection model, acting to decrease pathogenicity. Loss of PA-X expression leads to changes in the kinetics of the global host response, which notably includes increases in inflammatory, apoptotic, and T lymphocyte-signaling pathways. Thus, we have identified a previously unknown IAV protein that modulates the host response to infection, a finding with important implications for understanding IAV pathogenesis.
Figures
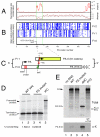
Fig. 1. Characterization of a ribosomal frameshift signal in IAV segment 3
(A) PA-frame synonymous site conservation in an alignment of 1278 representative full-length PA coding sequences. Shown is the synonymous substitution rate relative to the PA segment average (observed/expected) and the corresponding statistical significance (p-value). (B) Positions of stop codons (blue triangles) in the 3 reading frames in 71 representative PA coding sequences. (C) PA-X ORF structure, showing full-length PA in frame 0 and the X-ORF in frame 1, with experimental mutations indicated. (D, E) Detection of frameshifting in rabbit reticulocyte lysate by SDS-PAGE and autoradiography of IVT reactions. (D) Dual reporter constructs separated by the putative ribosomal frameshifting signal from PR8 segment 3 along with 100 nt 5′- and 3′-flanking sequence. WT: wild-type sequence; FS mutant: shiftsite UUU CGU mutated to UUC AGA; IFC: in-frame control. The calculated frameshifting (FS) efficiencies (mean±SEM, n = 4) are shown. (E) IVT reactions were programmed with full-length segment 3 constructs from the 1918 virus and analyzed before (Total) or after (α-X) immunoprecipitation with rabbit anti-1918 X serum. Lane 5 of the bottom panel shows a WT IVT immunoprecipitated with a preimmune bleed. Polypeptides of interest are indicated.
Fig. 2. PA-X mediated repression of plasmid-driven gene expression
293T cells were co-transfected with reporter plasmids encoding (A) ß-galactosidase or (B-D) IAV NP as well as the indicated ‘effector’ plasmids (400 ng unless indicated otherwise). (A) ß-galactosidase accumulation was measured by enzymatic assay. Values plotted are the mean±SEM of 3 experiments normalized to the level seen with an empty plasmid vector as effector. (B) NP, PA and tubulin (as a loading control) accumulation was measured by western blot and (C) quantified from replicate experiments using LiCor Odyssey software. Note in (B) that the same membrane was reprobed for tubulin; residual NP staining is apparent as a doublet running just above tubulin. (C, D) NP mRNA and 5S rRNA (as a loading control) were measured by urea-PAGE and autoradiography of radioactive primer extension assays. (C) NP mRNA accumulation was quantified by densitometry. Values plotted in (C) are the mean±range of two independent experiments, normalized to the control where PB2 was co-transfected in place of PA.
Fig. 3. Characterization of PA-X mutant viruses
(A) MDCK cells infected with the indicated viruses were metabolically labeled with 35S-methionine from 3-8 HPI. Cell lysates were immunoprecipitated with anti-X or the corresponding preimmune (PreI) serum and bound fractions analysed by SDS-PAGE and autoradiography. Aliquots of in vitro translated PA-X (IVT) were run in parallel as markers. The migration of molecular mass standards are also indicated. (B) Lysates from cells infected with the indicated viruses were analyzed by western blotting for PA. (C) Virus titers from MDCK cells (infected at a multiplicity of infection of ~ 0.001) or embryonated eggs (inoculated with 1000 PFU) were determined by plaque assay. Data are the means±SEM of 2-6 separate inoculations, except for 1918-PTC, which was grown once. (D, E) Lysates from MDCK cells infected with the indicated 1918 RNP viruses and metabolically labeled for 45 minute periods ending at the times shown were (D) analyzed by SDS-PAGE and autoradiography. (E) Actin synthesis at 8 HPI was quantified by densitometry. Data plotted are means±SEM of 3 independent experiments. Two-tailed p-values are indicated: (***) p < 0.0001; (**) p = 0.003; (*) p = 0.01.
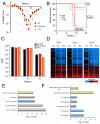
Fig. 4. Mutation of PA-X affects IAV pathogenicity in a murine model
(A) Mean weight loss of mice infected with 100 pfu of 1918-WT, -FS, and –PTC viruses (n=15, 15, and 10 respectively). Mice were humanely euthanized when they lost ≥ 25% of their initial body weight; no mice were found dead. Error bars represent ±SEM. (B) Survival proportions of mice infected with 10 (dotted line), 100 (solid line), or 1000 (dashed line) pfu of 1918-WT, -FS, and -PTC viruses. Data for WT and FS in (A) and (B) are pooled results obtained with two independently rescued sets of viruses, one set of which was subjected to high-throughput, full genome sequencing to confirm that the only changes between WT and FS were those deliberately introduced in PA. (C) Mean infectious titers of 1918 viruses in homogenized mouse lungs. Error bars represent the SEM. (D) Expression profile heatmaps generated from whole-lung RNA isolated from mice euthanized at 3, 5, and 8 DPI (n=4 per virus, per timepoint), displaying sequences that showed a ≥ 2-fold difference from mock-infected mouse lungs in at least one experimental group. Each column represents data from an individual experiment, while rows represent unique sequences; row-gene identities are preserved across timepoints. Genes in red are upregulated, those in blue are downregulated, and those in black do not differ as compared to a pool of RNA isolated from 6 mock-infected control mice. (E, F) Gene ontology analysis of sequences whose expression levels differed significantly (p < 0.01, ≥2-fold expression level difference) between 1918-WT and -FS infected lung tissue at 3 DPI with 100 pfu. (E) Top-scoring functional categories. (F) Top pathways within color-coded functional categories.
Comment in
- Virology. Frameshifting to PA-X influenza.
Yewdell JW, Ince WL. Yewdell JW, et al. Science. 2012 Jul 13;337(6091):164-5. doi: 10.1126/science.1225539. Science. 2012. PMID: 22798590 Free PMC article.
Similar articles
- Virology. Frameshifting to PA-X influenza.
Yewdell JW, Ince WL. Yewdell JW, et al. Science. 2012 Jul 13;337(6091):164-5. doi: 10.1126/science.1225539. Science. 2012. PMID: 22798590 Free PMC article. - Two amino acid residues in the N-terminal region of the polymerase acidic protein determine the virulence of Eurasian avian-like H1N1 swine influenza viruses in mice.
Yang Y, Xu C, Zhang N, Wan Y, Wu Y, Meng F, Chen Y, Yang H, Liu L, Qiao C, Chen H. Yang Y, et al. J Virol. 2024 Oct 22;98(10):e0129324. doi: 10.1128/jvi.01293-24. Epub 2024 Aug 30. J Virol. 2024. PMID: 39212447 Free PMC article. - Virulence and genetic compatibility of polymerase reassortant viruses derived from the pandemic (H1N1) 2009 influenza virus and circulating influenza A viruses.
Song MS, Pascua PN, Lee JH, Baek YH, Park KJ, Kwon HI, Park SJ, Kim CJ, Kim H, Webby RJ, Webster RG, Choi YK. Song MS, et al. J Virol. 2011 Jul;85(13):6275-86. doi: 10.1128/JVI.02125-10. Epub 2011 Apr 20. J Virol. 2011. PMID: 21507962 Free PMC article. - Virulence of pandemic (H1N1) 2009 influenza A polymerase reassortant viruses.
Song MS, Pascua PN, Choi YK. Song MS, et al. Virulence. 2011 Sep-Oct;2(5):422-6. doi: 10.4161/viru.2.5.17267. Epub 2011 Sep 1. Virulence. 2011. PMID: 21921678 Review. - Modulation of Innate Immune Responses by the Influenza A NS1 and PA-X Proteins.
Nogales A, Martinez-Sobrido L, Topham DJ, DeDiego ML. Nogales A, et al. Viruses. 2018 Dec 12;10(12):708. doi: 10.3390/v10120708. Viruses. 2018. PMID: 30545063 Free PMC article. Review.
Cited by
- Emerging roles for RNA degradation in viral replication and antiviral defense.
Abernathy E, Glaunsinger B. Abernathy E, et al. Virology. 2015 May;479-480:600-8. doi: 10.1016/j.virol.2015.02.007. Epub 2015 Feb 24. Virology. 2015. PMID: 25721579 Free PMC article. Review. - Ribosomal frameshifting and transcriptional slippage: From genetic steganography and cryptography to adventitious use.
Atkins JF, Loughran G, Bhatt PR, Firth AE, Baranov PV. Atkins JF, et al. Nucleic Acids Res. 2016 Sep 6;44(15):7007-78. doi: 10.1093/nar/gkw530. Epub 2016 Jul 19. Nucleic Acids Res. 2016. PMID: 27436286 Free PMC article. Review. - M2e-displaying virus-like particles with associated RNA promote T helper 1 type adaptive immunity against influenza A.
Ibañez LI, Roose K, De Filette M, Schotsaert M, De Sloovere J, Roels S, Pollard C, Schepens B, Grooten J, Fiers W, Saelens X. Ibañez LI, et al. PLoS One. 2013;8(3):e59081. doi: 10.1371/journal.pone.0059081. Epub 2013 Mar 18. PLoS One. 2013. PMID: 23527091 Free PMC article. - Mechanisms and consequences of mRNA destabilization during viral infections.
Shehata SI, Watkins JM, Burke JM, Parker R. Shehata SI, et al. Virol J. 2024 Feb 6;21(1):38. doi: 10.1186/s12985-024-02305-1. Virol J. 2024. PMID: 38321453 Free PMC article. Review. - Influenza Virus RNA Synthesis and the Innate Immune Response.
Weis S, Te Velthuis AJW. Weis S, et al. Viruses. 2021 Apr 28;13(5):780. doi: 10.3390/v13050780. Viruses. 2021. PMID: 33924859 Free PMC article. Review.
References
- Palese S, M.L. P. In: Fields Virology. Knipe DM, Howley PM, editors. Lippincott Williams & Wilkins, Philadelphia; 2007. p. 1647.
- Yuan P, et al. Crystal structure of an avian influenza polymerase PA(N) reveals an endonuclease active site. Nature. 2009;458:909. - PubMed
- Dias A, et al. The cap-snatching endonuclease of influenza virus polymerase resides in the PA subunit. Nature. 2009;458:914. - PubMed
Publication types
MeSH terms
Substances
Grants and funding
- MR/J002232/1/MRC_/Medical Research Council/United Kingdom
- 073126/WT_/Wellcome Trust/United Kingdom
- ImNIH/Intramural NIH HHS/United States
- G0700815/MRC_/Medical Research Council/United Kingdom
- G0700815(82260)/MRC_/Medical Research Council/United Kingdom
- WT_/Wellcome Trust/United Kingdom
- G9800943/MRC_/Medical Research Council/United Kingdom
- BB_/Biotechnology and Biological Sciences Research Council/United Kingdom
- 088789/WT_/Wellcome Trust/United Kingdom
LinkOut - more resources
Full Text Sources
Other Literature Sources
Molecular Biology Databases


