Single molecule analysis of serotonin transporter regulation using antagonist-conjugated quantum dots reveals restricted, p38 MAPK-dependent mobilization underlying uptake activation - PubMed (original) (raw)
Single molecule analysis of serotonin transporter regulation using antagonist-conjugated quantum dots reveals restricted, p38 MAPK-dependent mobilization underlying uptake activation
Jerry C Chang et al. J Neurosci. 2012.
Abstract
The presynaptic serotonin (5-HT) transporter (SERT) is targeted by widely prescribed antidepressant medications. Altered SERT expression or regulation has been implicated in multiple neuropsychiatric disorders, including anxiety, depression and autism. Here, we implement a generalizable strategy that exploits antagonist-conjugated quantum dots (Qdots) to monitor, for the first time, single SERT proteins on the surface of serotonergic cells. We document two pools of SERT proteins defined by lateral mobility, one that exhibits relatively free diffusion, and a second, localized to cholesterol and GM1 ganglioside-enriched microdomains, that displays restricted mobility. Receptor-linked signaling pathways that enhance SERT activity mobilize transporters that, nonetheless, remain confined to membrane microdomains. Mobilization of transporters arises from a p38 MAPK-dependent untethering of the SERT C terminus from the juxtamembrane actin cytoskeleton. Our studies establish the utility of ligand-conjugated Qdots for analysis of the behavior of single membrane proteins and reveal a physical basis for signaling-mediated SERT regulation.
Figures
Figure 1.
Tracking of Qdot-labeled single SERT proteins. A, Schematic of Qdot nanoconjugates for SERT labeling. The SERT ligand (IDT318) incorporates a biotin moiety to permit conjugation by SAv-Qdot, a PEG chain to reduce steric interference and nonspecific binding, an alkyl spacer to provide accessibility to the binding site, and a SERT-selective drug derivative to facilitate specific recognition of SERT. B, Time series images of single Qdot-SERT proteins on the surface close to the cell body (left column) or neuritic process (right column) of living RN46A cells. Time points where Qdot-labeled SERT proteins exhibit “blinking” are indicated by the dashed circles. C, Presence of SERT proteins within GM1 enriched membrane microdomains and their mobility in control and cholesterol depleted cells. First row: DIC images. Second row: staining of membrane rafts using Alexa 488-conjugated CTxB. Third row: Qdot-SERT proteins. Fourth row: colocalization of CTxB and Qdot labeling. Arrowheads note the presence of puncta labeled for both markers.
Figure 2.
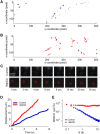
Single Qdot-SERT tracking in living serotonergic RN46A cells under control and MβCD-treated conditions. A, Full trajectory reconstruction from 30 s time-lapse videos of single Qdot-labeled SERT proteins in control (A) and cholesterol deleted (B) RN46A cells. Video frame size: 512 × 128 pixels, pixel size: 0.2 μm. Note the more mobile behavior of single SERT trajectories after MβCD treatment. C, Temporal profile of representative Qdot-labeled, single SERT proteins with and without MβCD treatment. D, Comparison of displacement over time of the representative single Qdot-SERT complexes in C. E, Plot of MSD/Δ_t_ as a function of Δ_t_ of the representative single SERT proteins in C on a log-log scale. Single SERT under MβCD-treated condition shows the pattern expected of free diffusion whereas SERT from untreated cells demonstrates a pattern consistent with motion restriction, or anomalous subdiffusion. White, dashed lines in E represent a least-squares best-fit of the data.
Figure 3.
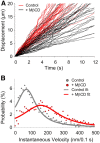
Single Qdot-labeled SERT proteins demonstrate elevated SERT lateral mobility after membrane raft disruption. A, Distributions of the instantaneous displacement of single SERT proteins in control (black, n = 52) and MβCD-treated (red, n = 51) conditions. B, Comparison of instantaneous velocities of single SERT proteins in untreated and MβCD-treated RN46A cells. Each set of data was collected from 3 independent experiments.
Figure 4.
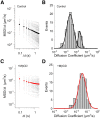
Characterization of the dynamic behavior of single SERT proteins. Plots of MSD/Δ_t_ as a function of Δ_t_ and distribution of diffusion coefficient of single SERT proteins in control cells (A, B; n = 98) and in MβCD-treated cells (C, D, n = 91). A, B, Although the variability exists in both cases, the majority of SERT proteins in untreated cells display confined diffusion pattern with lower diffusion coefficient values. C, D, In contrast, single SERT proteins after MβCD treatment follow free diffusion with higher diffusion coefficients. Black circles in A and red circles in C present the average MSD/Δ_t_. B and D were fit to double and single Gaussian distributions, respectively.
Figure 5.
Effect of 8-Br-cGMP on SERT lateral mobility. A, Comparison of instantaneous velocities of single SERT proteins in untreated and 8-Br-cGMP stimulated cells. B, Distribution of diffusion coefficient of single SERT proteins (n = 90) after 8-Br-cGMP treatment and fit with double Gaussian distributions. C, Plots of MSD/Δ_t_ as a function of Δ_t_ of single SERT proteins (n = 90) in MβCD-treated cells are shown. Black circles and red circles show the average MSD/Δ_t_ of constrained (75.6%) and mobile (24.5%) population of single SERT trajectories. D, Comparison of instantaneous velocities of single SERT proteins in 8-Br-cGMP stimulated or 8-Br-cGMP plus SB203580 (SB) cotreated cells. Data derived from 3–6 independent experiments.
Figure 6.
p38 MAPK-dependent increase in SERT mobility in the absence of lateral dispersion. A–E, 2D Polar plots of 5 s displacements (d5s) of single SERT movements, normalized to their starting coordinates under control, MβCD, 8-Br-cGMP, 8-Br-cGMP plus SB203580, and IL-1β-treated conditions, respectively. Plots provide data in pixel units (200 nm/pixel). Data were collected from 3 to 6 independent experiments with 90–100 trajectories for each condition. F, Comparison of instantaneous velocities of single SERT proteins in untreated and IL-1β stimulated cells. The best-fit velocity distribution of IL-1β-treated SERT proteins reveals a dominant population (76.9%) with higher velocities and a minor population (23.1%) with lower velocities. G, Distribution of diffusion coefficient of single SERT proteins (n = 99) after IL-1β treatment (double Gaussian fit).
Figure 7.
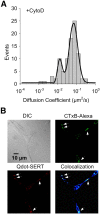
A, Increased lateral diffusion of Qdot labeled SERT proteins after CytoD treatment. Data fit with double Gaussian distributions. B, Retention of SERT proteins within membrane rafts in CytoD-pretreated RN46A cells. Upper left: DIC image; Upper right: staining of membrane rafts using Alexa 488-conjugated CTxB; Lower left: Qdot-SERT proteins; Lower right: colocalization of CTxB and Qdot labeling. Arrowheads denote the presence of multiple puncta labeled for both markers.
Figure 8.
Actin cytoskeleton restricts SERT mobility within membrane microdomains in a p38 MAPK and SERT C terminus-dependent manner. Plots of instantaneous velocity of A, single Qdot-labeled SERT proteins in RN46A cells treated with CytoD, B, single Qdot-labeled GM1/CTxB complexes in RN46A cells treated with CytoD, C, single Qdot-labeled SERT proteins in RN46A cells treated with CytoD after IL-1β stimulation, and D, single Qdot-labeled SERT proteins in RN46A cells treated with C-SERT peptide. Each condition represents results of three independent experiments.
Figure 9.
A, B, Distribution of diffusion coefficient of single SERT proteins after C-SERT (A) and U-SERT (B) peptide treatments and fit with double Gaussian distributions. Data collected from five independent experiments. C, SERT activity in RN46A cells after U-SERT peptide treatment. SERT activity was monitored using the fluorescent monoamine transporter substrate IDT307 (see Materials and Methods, Cell culture, treatments, and SERT activity assay). Data shown are representative of time-lapse microphotographs (right) and fluorescent quantification (p < 0.01, Student's t test; left) obtained in three independent experiments.
Figure 10.
Model for SERT-cytoskeletal interactions dictating cell surface transporter regulation. In the resting state, SERT is present in two compartments, one that permits free diffusion in the membrane (left), and a second compartment that represents confinement to membrane microdomains (center) where transporters are immobilized by cytoskeleton-associated proteins (middle). When cytoskeleton-associated constraints are relaxed in response to PKG/IL-1β/p38 MAPK activation (or through actin destabilizers or C-SERT peptide treatments), SERT remains confined to membrane microdomains (right), though now transporters can adopt conformations that favor increased transport activity. Question mark overlying transitions into and out of membrane microdomains denotes the possibility that such movements could also play a role in SERT regulation, though they are not features of the PKG and p38 MAPK-dependent SERT regulation detected in the current study.
Similar articles
- cGMP-dependent protein kinase Ialpha associates with the antidepressant-sensitive serotonin transporter and dictates rapid modulation of serotonin uptake.
Steiner JA, Carneiro AM, Wright J, Matthies HJ, Prasad HC, Nicki CK, Dostmann WR, Buchanan CC, Corbin JD, Francis SH, Blakely RD. Steiner JA, et al. Mol Brain. 2009 Aug 5;2:26. doi: 10.1186/1756-6606-2-26. Mol Brain. 2009. PMID: 19656393 Free PMC article. - A role for p38 mitogen-activated protein kinase in the regulation of the serotonin transporter: evidence for distinct cellular mechanisms involved in transporter surface expression.
Samuvel DJ, Jayanthi LD, Bhat NR, Ramamoorthy S. Samuvel DJ, et al. J Neurosci. 2005 Jan 5;25(1):29-41. doi: 10.1523/JNEUROSCI.3754-04.2005. J Neurosci. 2005. PMID: 15634764 Free PMC article. - Monitoring mouse serotonin transporter internalization in stem cell-derived serotonergic neurons by confocal laser scanning microscopy.
Lau T, Horschitz S, Bartsch D, Schloss P. Lau T, et al. Neurochem Int. 2009 Mar-Apr;54(3-4):271-6. doi: 10.1016/j.neuint.2008.12.004. Epub 2008 Dec 11. Neurochem Int. 2009. PMID: 19121357 - Going with the flow: trafficking-dependent and -independent regulation of serotonin transport.
Steiner JA, Carneiro AM, Blakely RD. Steiner JA, et al. Traffic. 2008 Sep;9(9):1393-402. doi: 10.1111/j.1600-0854.2008.00757.x. Epub 2008 Apr 28. Traffic. 2008. PMID: 18445122 Free PMC article. Review. - Behavioral and serotonergic consequences of decreasing or increasing hippocampus brain-derived neurotrophic factor protein levels in mice.
Deltheil T, Guiard BP, Cerdan J, David DJ, Tanaka KF, Repérant C, Guilloux JP, Coudoré F, Hen R, Gardier AM. Deltheil T, et al. Neuropharmacology. 2008 Nov;55(6):1006-14. doi: 10.1016/j.neuropharm.2008.08.001. Epub 2008 Aug 12. Neuropharmacology. 2008. PMID: 18761360 Review.
Cited by
- Action potentials and amphetamine release antipsychotic drug from dopamine neuron synaptic VMAT vesicles.
Tucker KR, Block ER, Levitan ES. Tucker KR, et al. Proc Natl Acad Sci U S A. 2015 Aug 11;112(32):E4485-94. doi: 10.1073/pnas.1503766112. Epub 2015 Jul 27. Proc Natl Acad Sci U S A. 2015. PMID: 26216995 Free PMC article. - Regulation of monoamine transporters and receptors by lipid microdomains: implications for depression.
Liu JJ, Hezghia A, Shaikh SR, Cenido JF, Stark RE, Mann JJ, Sublette ME. Liu JJ, et al. Neuropsychopharmacology. 2018 Oct;43(11):2165-2179. doi: 10.1038/s41386-018-0133-6. Epub 2018 Jun 28. Neuropsychopharmacology. 2018. PMID: 30022062 Free PMC article. Review. - Rare copy number variation in treatment-resistant major depressive disorder.
O'Dushlaine C, Ripke S, Ruderfer DM, Hamilton SP, Fava M, Iosifescu DV, Kohane IS, Churchill SE, Castro VM, Clements CC, Blumenthal SR, Murphy SN, Smoller JW, Perlis RH. O'Dushlaine C, et al. Biol Psychiatry. 2014 Oct 1;76(7):536-41. doi: 10.1016/j.biopsych.2013.10.028. Epub 2014 Jan 19. Biol Psychiatry. 2014. PMID: 24529801 Free PMC article. - Adaptor complex AP2/PICALM, through interaction with LC3, targets Alzheimer's APP-CTF for terminal degradation via autophagy.
Tian Y, Chang JC, Fan EY, Flajolet M, Greengard P. Tian Y, et al. Proc Natl Acad Sci U S A. 2013 Oct 15;110(42):17071-6. doi: 10.1073/pnas.1315110110. Epub 2013 Sep 25. Proc Natl Acad Sci U S A. 2013. PMID: 24067654 Free PMC article. - Multiplexed modular genetic targeting of quantum dots.
Saurabh S, Beck LE, Maji S, Baty CJ, Wang Y, Yan Q, Watkins SC, Bruchez MP. Saurabh S, et al. ACS Nano. 2014 Nov 25;8(11):11138-46. doi: 10.1021/nn5044367. Epub 2014 Nov 12. ACS Nano. 2014. PMID: 25380615 Free PMC article.
References
- Adkins EM, Barker EL, Blakely RD. Interactions of tryptamine derivatives with serotonin transporter species variants implicate transmembrane domain I in substrate recognition. Mol Pharmacol. 2001;59:514–523. - PubMed
- Adkins EM, Samuvel DJ, Fog JU, Eriksen J, Jayanthi LD, Vaegter CB, Ramamoorthy S, Gether U. Membrane mobility and microdomain association of the dopamine transporter studied with fluorescence correlation spectroscopy and fluorescence recovery after photobleaching. Biochemistry. 2007;46:10484–10497. - PubMed
- Alivisatos P. The use of nanocrystals in biological detection. Nat Biotechnol. 2004;22:47–52. - PubMed
- Allen JA, Halverson-Tamboli RA, Rasenick MM. Lipid raft microdomains and neurotransmitter signalling. Nat Rev Neurosci. 2007;8:128–140. - PubMed
Publication types
MeSH terms
Substances
Grants and funding
- R01 MH094527/MH/NIMH NIH HHS/United States
- GM72048-02/GM/NIGMS NIH HHS/United States
- 090532/Wellcome Trust/United Kingdom
- R01EB003728-02/EB/NIBIB NIH HHS/United States
- MH094527/MH/NIMH NIH HHS/United States
- R01 DK085064/DK/NIDDK NIH HHS/United States
- P20 GM072048/GM/NIGMS NIH HHS/United States
- R01 EB003728/EB/NIBIB NIH HHS/United States
- MH096972/MH/NIMH NIH HHS/United States
- P50 MH096972/MH/NIMH NIH HHS/United States
LinkOut - more resources
Full Text Sources


