GM-CSF controls nonlymphoid tissue dendritic cell homeostasis but is dispensable for the differentiation of inflammatory dendritic cells - PubMed (original) (raw)
. 2012 Jun 29;36(6):1031-46.
doi: 10.1016/j.immuni.2012.03.027.
Julie Helft, Andrew Chow, Daigo Hashimoto, Arthur Mortha, Judith Agudo-Cantero, Milena Bogunovic, Emmanuel L Gautier, Jennifer Miller, Marylene Leboeuf, Geming Lu, Costica Aloman, Brian D Brown, Jeffrey W Pollard, Huabao Xiong, Gwendalyn J Randolph, Jerry E Chipuk, Paul S Frenette, Miriam Merad
Affiliations
- PMID: 22749353
- PMCID: PMC3498051
- DOI: 10.1016/j.immuni.2012.03.027
GM-CSF controls nonlymphoid tissue dendritic cell homeostasis but is dispensable for the differentiation of inflammatory dendritic cells
Melanie Greter et al. Immunity. 2012.
Abstract
GM-CSF (Csf-2) is a critical cytokine for the in vitro generation of dendritic cells (DCs) and is thought to control the development of inflammatory DCs and resident CD103(+) DCs in some tissues. Here we showed that in contrast to the current understanding, Csf-2 receptor acts in the steady state to promote the survival and homeostasis of nonlymphoid tissue-resident CD103(+) and CD11b(+) DCs. Absence of Csf-2 receptor on lung DCs abrogated the induction of CD8(+) T cell immunity after immunization with particulate antigens. In contrast, Csf-2 receptor was dispensable for the differentiation and innate function of inflammatory DCs during acute injuries. Instead, inflammatory DCs required Csf-1 receptor for their development. Thus, Csf-2 is important in vaccine-induced CD8(+) T cell immunity through the regulation of nonlymphoid tissue DC homeostasis rather than control of inflammatory DCs in vivo.
Copyright © 2012 Elsevier Inc. All rights reserved.
Figures
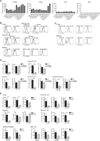
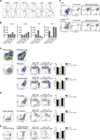
Figure 1. Csf-2r Is Highly Expressed on Nonlymphoid Tissue-Resident DCs in the Steady State
(A) Csf2rb, Csf2ra, Il3ra, and Il5ra expression profile of purified tissue DC populations was analyzed with Affymetrix gene chip arrays. Graphs show the relative mRNA expression of purified spleen-resident CD8+ and CD11b+ DCs, nonlymphoid tissue-resident CD103+ and CD11b+ DC subsets, migratory CD103+ and CD11b+ DCs in tissue-draining LNs, and epidermal and migratory LCs in skin-draining LNs isolated as described in Figure S1. Bar graphs represent the mean ± SEM (n ≥ 3). Spl, spleen; SLN, skin-draining LN; SI, small intestine. (B) Histograms depict the expression of Csf-2rb on DCs isolated from lymphoid and nonlymphoid tissues and CD4+ (CD4+MHCII−) and CD8+ (CD8+MHCII−) T cells and neutrophils (SSChiCD11b+Gr1+) isolated from the spleen of WT mice. Dashed gray line, isotype control; solid black line, anti-Csf-2rb (CD131). (C) Histograms depict the expression of IL-3ra and IL-5ra on DCs isolated from the spleen and lung of WT mice. Dashed gray line, isotype control; solid black line, IL-3ra (CD123) and IL-5ra (CD125) antibody. (D and E) WT mice, _Csf2rb_−/−_Csf2rb2_−/− mice (D), and _Csf2_−/− mice (E) were analyzed for the presence of the DC subsets as described in Figure S1A. Graphs show the absolute cell numbers of DCs in the lung (D and E: n = 6) and in the dermis (D and E: n ≥ 7), migratory DCs in skin-draining LNs (D and E: n = 4), lung-draining LNs (D and E: n = 4), and mesenteric (mes.) LNs (E: n = 3), and DCs in the lamina propria (D: n = 3, E: n = 4). Bar graphs represent the mean ± SEM. *p < 0.05, **p < 0.01, ***p < 0.001 (Student’s t test, unpaired). See also Figure S2.
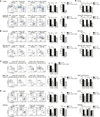
Figure 2. Csf-2r Controls the Development of Nonlymphoid Tissue DCs
Mixed BM chimeras (CD45.1+ WT:CD45.2+ WT and CD45.1+ WT:CD45.2+_Csf2rb_−/−_Csf2rb2_−/− (A–D), CD45.1+ WT:CD45.2+_Csf2rb_−/− (E)) were analyzed for the presence of CD45.1+ and CD45.2+ DCs. Dot plots show the percentage of CD45.1+ WT and CD45.2+_Csf2rb_−/−_Csf2rb2_−/− nonlymphoid tissue-resident DCs and LN-migratory DCs as described in Figure S1A. Bar graphs display the percentage ± SEM of CD45.2+ WT and CD45.2+_Csf2rb_−/−_Csf2rb2_−/− DCs (A–D) or CD45.2+_Csf2rb_−/− DCs (E). (A)–(D): Lung and lung-draining LNs, n = 6; skin-draining LNs, n = 7; dermis, n = 9; lamina propria and mesenteric LNs, n = 4; liver, n = 10; kidney, n = 4. (E): For all tissues, n = 3. *p < 0.05, **p < 0.01, ***p < 0.001 (Student’s t test, unpaired). See also Figure S3.
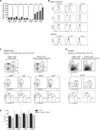
Figure 3. Csf-2r Does Not Control the Differentiation of DC-Restricted Precursors in the Bone Marrow
(A) Csf2rb, Csf2rb2, Csf2ra, Il3ra, Il5ra, Csf1r, and Flt3 expression profile of purified precursor populations (CDPs and MDPs) from the BM of WT mice was analyzed with Affymetrix gene chip arrays. Graphs show the relative mRNA expression as the mean ± SEM (n ≥ 3). (B) Histograms depict the expression of Csf-2rb, IL-3ra, and IL-5ra on MDPs, CDPs, and preDCs isolated from the BM and preDCs isolated from the spleen. Dashed gray line, isotype control; solid black line, antibodies against Csf-2rb, IL-3ra, and IL-5ra. (C–E) Dot plots (C and D) depict the gating strategy to measure MDPs, CDPs (C), and preDCs (D) in the BM of mixed BM chimeras (CD45.1+ WT:CD45.2+ WT or CD45.1+ WT:CD45.2+_Csf2rb_−/−_Csf2rb2_−/−). Bar graphs (E) show the percentage ± SEM of CD45.2+ circulating Ly6Chi monocytes and BM preDCs, MDPs, and CDPs in mixed BM chimeric mice (n = 4).
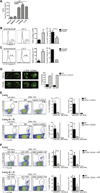
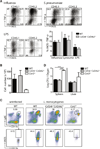
Figure 4. Csf2rb−/−Csf2rb2−/− Mice Cannot Mount CD8+ T Cell Immunity upon Intratracheal Immunization with OVA Beads and Poly(I:C)
(A) Sera, lymphoid, and nonlymphoid tissues derived from naive WT mice were analyzed for Csf-2 levels by ELISA. Bars represent the mean ± SEM (n = 5). (B and C) Splenic DCs (B) and lung CD103+ DCs (C) were isolated from WT animals and cultured for 24 hr with or without Csf-2. Plots show the percentage of active Caspase-3+ DCs and the total cell number of viable DCs (n ≥ 2). (D) CD103+ and CD11b+ DCs were sorted from the lungs of CD45.1+ WT:CD45.2+_Csf2rb_−/−_Csf2rb2_−/− BM chimeric mice and stained with Mitogreen. Images show Mitogreen-stained DCs. Scale bar represents 10 µm. Bar graph depicts the percentage of DCs with fragmented mitochondria (n ≥ 100 cells). (E and F) WT and _Csf2rb_−/−_Csf2rb2_−/− mice (E) and WT and _Csf2rb_−/−_Csf2rb2_−/− BM chimeric mice (WT→WT and _Csf2rb_−/−→WT) (F) were immunized i.t. with OVA-coated latex beads mixed with poly(I:C) (OVA/PIC) or left untreated. 7 days after immunization, lungs and lung-draining LNs were analyzed for the presence of OVA-specific CD8+ T cells via H2Kb/SIINFEKL-specific pentamers. Nonimmunized (not imm.) mice were used as controls. Plots represent the percentage and total cell number of OVA-specific CD8+ T cells (gated on B220−CD3+CD8+ cells) ± SEM (n = 3). *p < 0.05, **p < 0.01, ***p < 0.001 (Student’s t test, unpaired). See also Figures S4 and S5.
Figure 5. Inflammatory DCs Develop Independently of Csf-2r Signaling
(A) WT mice were inoculated i.n. with PR8 influenza virus. Histograms depict phenotypic analysis of inflammatory DCs that accumulate in the lungs on day 3 postinfection. Dashed gray line, isotype; solid black line, markers as indicated above the histograms. (B) Graphs display Csf2rb, Csf2ra, Flt3, and Csf1r relative mRNA expression in naive WT Ly6Chi blood monocytes, lung CD11b+ and CD103+ DCs isolated from naive WT mice, and inflammatory DCs (infl. DCs) isolated from the lungs of influenza virus-infected WT mice. (C–E) Mixed BM chimeras (CD45.1+ WT:CD45.2+ WT or CD45.1+ WT:CD45.2+_Csf2rb_−/−_Csf2rb2_−/−) were either left untreated or submitted to infections or inflammation stimuli. Dot plots show the percentage of CD45.1+ WT, CD45.2+_Csf2rb_−/−_Csf2rb2_−/−, or CD45.2+ WT DCs among total inflammatory DCs (DAPI−CD11c+MHCII+CD11b+Ly6C+). Bar graphs display the percentage of CD45.2+ inflammatory DCs of pooled experiments. As a reference population, circulating CD45.2+ WT or _Csf2rb_−/−_Csf2rb2_−/−Ly6Chi monocytes are shown. (C) Mice were inoculated i.n. with influenza virus (n = 3) or S. pneumoniae (n = 4) and lungs were isolated 3 days later. (D) Mice were injected with LPS i.v. and lungs and spleens were analyzed 24 hr later (n = 3). (E) Mice were inoculated orally with S. Tymphimurium and lamina propria cells were analyzed 4 days later (n ≥ 3). (F) Naive CD45.1+CD45.2+ F1 recipient mice were infected i.n. with influenza virus 24 hr prior to i.v. injection of a 1:1 mixture of CD45.1+ WT:CD45.2+_Csf2rb_−/−_Csf2rb2_−/−Ly6Chi monocytes. Dot plots display the percentage of CD45.1+ WT or CD45.2+_Csf2rb_−/−_Csf2rb2_−/− monocyte-derived inflammatory DCs (CD11c+MHCII+CD11b+Ly6C+) in the lungs and lung-draining LNs on day 3 after transfer. One representative of two independent experiments is shown. See also Figure S6.
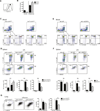
Figure 6. Csf2rb−/−Csf2rb2−/− Inflammatory DCs Can Efficiently Control Initial L. monocytogenes Burden
(A) CD45.1+ WT:CD45.2+_Csf2rb_−/−_Csf2rb2_−/− BM chimeras were infected i.n. with influenza virus (n = 3) or S. pneumoniae (n = 4) or injected with LPS i.v. (n = 3) as described in Figure 5. Graph and dot plots show the percentage of iNOS and TNF-α expression among CD45.1+ WT or CD45.2+_Csf2rb_−/−_Csf2rb2_−/− inflammatory DCs (CD11c+MHCII+CD11b+Ly6C+) isolated from the infected lungs. (B–D) WT, _Csf2rb−/−Csf2rb2_−/−, and Ccr2−/− mice were inoculated i.p. with L. monocytogenes. (B) Absolute cell number of inflammatory DCs gated on total DCs on day 3 postimmunization ± SEM (n = 4). (C) Dot plots display the percentage of inflammatory DCs gated on total DCs (CD11c+MCHII+) and the percentage of inflammatory DCs expressing iNOS in the spleens of WT, _Csf2rb−/−Csf2rb2_−/−, and Ccr2−/− mice on day 3 after infection. (D) Bar graph shows L. monocytogenes colony forming units (CFU) in the spleens and livers ± SEM (n = 4) on day 3 after infection. *p < 0.05, **p < 0.01, ***p < 0.001 (Student’s t test, unpaired).
Figure 7. Csf-1r Signaling Controls the Development of Inflammatory DCs
(A) Histogram depicts CD115 expression of splenic inflammatory DCs isolated from LPS-treated WT mice. Dashed gray line, isotype control; solid black line, CD115 antibody. (B) Lungs isolated from uninfected and influenza-infected WT mice were analyzed for Csf-1 and Csf-2 by ELISA (n = 3). (C–F) Rosa26CreER+ (Cre+) × _Csf1r_fl/fl and Rosa26CreER+ (Cre+) × _Csf1r_fl/fl control mice were treated with tamoxifen (C, D) and WT mice were injected with Csf-1r antibody (αCsf-1r) (E, F). Seven days after treatment with tamoxifen or αCsf-1r, mice were injected i.v. with LPS. (C and E) Dot plots display the percentage of SSCloCD11b+Ly6C+Csf-1r (CD115)+ F4/80+ circulating monocytes prior to LPS injection. (D–F) Dot plots show the percentage of splenic monocytes (R1) (DAPI−Ly6G−CD11b+Ly6C+F4/80+). R2 represents MHCII+CD11c+ DCs among gated R1 spleen monocytes. Graphs display the mean percentage and absolute cell number of spleen monocytes (R1) and inflammatory DC (R2) from combined experiments ± SEM on day 1 after LPS injection (n = 3 for controls [ctrl., no LPS], n = 6 for LPS-treated groups). (G) Cre+ × _Csf1r_fl/fl and Cre− × _Csf1r_fl/fl mice were treated with tamoxifen 14 days prior to being infected i.n. with influenza virus. Dot plots show the percentage and absolute cell number of lung inflammatory DCs (DAPI−CD45+Siglec-F−Ly6G−CD11b+F4/80+) 3 days after virus infection (n = 2 for control [not infected], n ≥ 4 for influenza virus-infected mice). *p < 0.05, **p < 0.01, ***p < 0.001 (Student’s t test, unpaired). See also Figure S7.
Similar articles
- Batf3-dependent CD11b(low/-) peripheral dendritic cells are GM-CSF-independent and are not required for Th cell priming after subcutaneous immunization.
Edelson BT, Bradstreet TR, KC W, Hildner K, Herzog JW, Sim J, Russell JH, Murphy TL, Unanue ER, Murphy KM. Edelson BT, et al. PLoS One. 2011;6(10):e25660. doi: 10.1371/journal.pone.0025660. Epub 2011 Oct 17. PLoS One. 2011. PMID: 22065991 Free PMC article. - GM-CSF increases cross-presentation and CD103 expression by mouse CD8⁺ spleen dendritic cells.
Zhan Y, Carrington EM, van Nieuwenhuijze A, Bedoui S, Seah S, Xu Y, Wang N, Mintern JD, Villadangos JA, Wicks IP, Lew AM. Zhan Y, et al. Eur J Immunol. 2011 Sep;41(9):2585-95. doi: 10.1002/eji.201141540. Epub 2011 Aug 4. Eur J Immunol. 2011. PMID: 21660938 - GM-CSF-dependent, CD103+ dermal dendritic cells play a critical role in Th effector cell differentiation after subcutaneous immunization.
King IL, Kroenke MA, Segal BM. King IL, et al. J Exp Med. 2010 May 10;207(5):953-61. doi: 10.1084/jem.20091844. Epub 2010 Apr 26. J Exp Med. 2010. PMID: 20421390 Free PMC article. - The regulation of the development and function of dendritic cell subsets by GM-CSF: more than a hematopoietic growth factor.
Zhan Y, Xu Y, Lew AM. Zhan Y, et al. Mol Immunol. 2012 Aug;52(1):30-7. doi: 10.1016/j.molimm.2012.04.009. Epub 2012 May 14. Mol Immunol. 2012. PMID: 22580403 Review. - GM-CSF in the generation of dendritic cells from human blood monocyte precursors: recent advances.
Conti L, Gessani S. Conti L, et al. Immunobiology. 2008;213(9-10):859-70. doi: 10.1016/j.imbio.2008.07.017. Epub 2008 Sep 2. Immunobiology. 2008. PMID: 18926300 Review.
Cited by
- Inhaled GM-CSF administered during ongoing pneumovirus infection alters myeloid and CD8 T cell immunity without affecting disease outcome.
Debeuf N, Deckers J, Lameire S, Bosteels C, Hammad H, Lambrecht BN. Debeuf N, et al. Front Immunol. 2024 Oct 8;15:1439789. doi: 10.3389/fimmu.2024.1439789. eCollection 2024. Front Immunol. 2024. PMID: 39439800 Free PMC article. - Cytokines reprogram airway sensory neurons in asthma.
Crosson T, Bhat S, Wang JC, Salaun C, Fontaine E, Roversi K, Herzog H, Rafei M, Blunck R, Talbot S. Crosson T, et al. bioRxiv [Preprint]. 2024 Sep 18:2023.01.26.525731. doi: 10.1101/2023.01.26.525731. bioRxiv. 2024. PMID: 39345572 Free PMC article. Preprint. - Chemical respiratory sensitization-Current status of mechanistic understanding, knowledge gaps and possible identification methods of sensitizers.
Hargitai R, Parráková L, Szatmári T, Monfort-Lanzas P, Galbiati V, Audouze K, Jornod F, Staal YCM, Burla S, Chary A, Gutleb AC, Lumniczky K, Vandebriel RJ, Gostner JM. Hargitai R, et al. Front Toxicol. 2024 Jul 29;6:1331803. doi: 10.3389/ftox.2024.1331803. eCollection 2024. Front Toxicol. 2024. PMID: 39135743 Free PMC article. Review. - GM-CSF-dependent CD301b+ lung dendritic cells confer tolerance to inhaled allergens.
Wilkinson CL, Nakano K, Grimm SA, Whitehead GS, Arao Y, Blackshear PJ, Karmaus PW, Fessler MB, Cook DN, Nakano H. Wilkinson CL, et al. Res Sq [Preprint]. 2024 Jun 4:rs.3.rs-4414130. doi: 10.21203/rs.3.rs-4414130/v1. Res Sq. 2024. PMID: 38883724 Free PMC article. Preprint. - Novel insights into the sexual dimorphism-associated immune response.
Izquierdo JM. Izquierdo JM. Cell Mol Immunol. 2024 Aug;21(8):804-806. doi: 10.1038/s41423-024-01177-3. Epub 2024 May 13. Cell Mol Immunol. 2024. PMID: 38740923 No abstract available.
References
- Banchereau J, Palucka AK. Dendritic cells as therapeutic vaccines against cancer. Nat. Rev. Immunol. 2005;5:296–306. - PubMed
Publication types
MeSH terms
Substances
Grants and funding
- P01 CA100324/CA/NCI NIH HHS/United States
- R56 AI091871/AI/NIAID NIH HHS/United States
- R56AI091871/AI/NIAID NIH HHS/United States
- DP2DK083052-01/DK/NIDDK NIH HHS/United States
- R01 HL086899/HL/NHLBI NIH HHS/United States
- AI049653/AI/NIAID NIH HHS/United States
- AI095611/AI/NIAID NIH HHS/United States
- HL69438/HL/NHLBI NIH HHS/United States
- K08 DK088954/DK/NIDDK NIH HHS/United States
- DP2 DK083052/DK/NIDDK NIH HHS/United States
- R01 CA173861/CA/NCI NIH HHS/United States
- R01 CA131270/CA/NCI NIH HHS/United States
- HL097819/HL/NHLBI NIH HHS/United States
- G1002033/MRC_/Medical Research Council/United Kingdom
- R37 AI049653/AI/NIAID NIH HHS/United States
- R01 HL069438/HL/NHLBI NIH HHS/United States
- R01 CA154947/CA/NCI NIH HHS/United States
- DK056638/DK/NIDDK NIH HHS/United States
- R01 HL097819/HL/NHLBI NIH HHS/United States
- CA157740/CA/NCI NIH HHS/United States
- HL097700/HL/NHLBI NIH HHS/United States
- R01 HL097700/HL/NHLBI NIH HHS/United States
- R01 AI049653/AI/NIAID NIH HHS/United States
- HL086899/HL/NHLBI NIH HHS/United States
- CA154947/CA/NCI NIH HHS/United States
- U01 AI095611/AI/NIAID NIH HHS/United States
- R01 CA157740/CA/NCI NIH HHS/United States
- R01 DK056638/DK/NIDDK NIH HHS/United States
LinkOut - more resources
Full Text Sources
Other Literature Sources
Molecular Biology Databases
Research Materials
Miscellaneous
