Ultrasensitive clinical enumeration of rare cells ex vivo using a micro-hall detector - PubMed (original) (raw)
Ultrasensitive clinical enumeration of rare cells ex vivo using a micro-hall detector
David Issadore et al. Sci Transl Med. 2012.
Abstract
The ability to detect rare cells (<100 cells/ml whole blood) and obtain quantitative measurements of specific biomarkers on single cells is increasingly important in basic biomedical research. Implementing such methodology for widespread use in the clinic, however, has been hampered by low cell density, small sample sizes, and requisite sample purification. To overcome these challenges, we have developed a microfluidic chip-based micro-Hall detector (μHD), which can directly measure single, immunomagnetically tagged cells in whole blood. The μHD can detect single cells even in the presence of vast numbers of blood cells and unbound reactants, and does not require any washing or purification steps. In addition, the high bandwidth and sensitivity of the semiconductor technology used in the μHD enables high-throughput screening (currently ~10(7) cells/min). The clinical use of the μHD chip was demonstrated by detecting circulating tumor cells in whole blood of 20 ovarian cancer patients at higher sensitivity than currently possible with clinical standards. Furthermore, the use of a panel of magnetic nanoparticles, distinguished with unique magnetization properties and bio-orthogonal chemistry, allowed simultaneous detection of the biomarkers epithelial cell adhesion molecule (EpCAM), human epidermal growth factor receptor 2 (HER2)/neu, and epidermal growth factor receptor (EGFR) on individual cells. This cost-effective, single-cell analytical technique is well suited to perform molecular and cellular diagnosis of rare cells in the clinic.
Conflict of interest statement
Competing interests: The authors declare no competing interests.
Figures
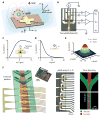
Figure 1. Design and implementation of the micro-Hall detector (μHD)
(A) Cells labeled with magnetic nanoparticles (MNPs) assume a magnetic moment proportional to the expression of the targeted biomarker. The microfabricated Hall (μHall) sensors measure the magnetic moment associated with each MNP-labeled cell via the Hall voltage VH. A large external magnetic field (_B_0 > 1 T) fully magnetized the MNPs, without saturating the sensors. (B) The Hall voltages (VH) are measured using capacitively coupled amplifiers, which block constant signal from the external field (_B_0), and then digitized with an analog to digital converted (ADC). (C) A computer model calculates the magnetic field _B_⊥ normal to the chip’s surface, which is produced by a magnetic dipole at a specific position (x, y, z). VH is a function of the sensor size (w, l) for a magnetic dipole at a height d = 4 μm above the chip surface. (D) Simulation of the normalized VH as a function of the height of a bead at (x, y) = (0, 0). The sensor size is 8 × 8 μm2. (E) Simulation of the normalized VH for a bead at a height d = 4 μm as a function of x and y over a sensor. (F) The μHD consists of an array of μHall sensors with a microfluidic channel placed on top (left). The inset is a photograph of the μHD, showing the microfabricated GaAs substrate with the PDMS microfluidics directly on top. The sensor array (center) has eight staggered μHall elements, each of which can accurately detect cells passing across the channel width. Dotted lines indicate the position of the sample flow channel. The fluidic structure (right) uses hydrodynamic focusing to laterally position cells into the middle of the channel, and chevron patterns to push cells vertically towards the bottom of the channel.
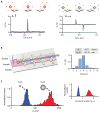
Figure 2. Characterization of the μHD
(A) VH from the passing of a single magnetic bead was measured with the magnetic field either perpendicular (left) or parallel (right) to the sensor plane. (B) The Hall voltages from the eight staggered sensors were used to calculate both the position (x, z) and magnetization (m) of each passing object, which is proportional to the number of biomarkers N for each cell. (C) The averaged VH across the μHall array was used to estimate each cell’s induced magnetic moment, m. As proof-of-concept, a mixture of 3 and 8 μm magnetic beads with the same magnetization were passed over the μHall array. A histogram of the averaged Hall voltage 〈_VH_〉1/3 (〈_VH_〉 ∝ _a_3), in which the x-axis is proportional to the diameter a of the beads, correlated with expected values and with corresponding flow cytometry data (right).
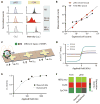
Figure 3. Profiling biomarkers on individual cultured tumor cells
(A) A human breast cancer cell line (MDA-MB-453) was profiled for three cancer biomarkers: EGFR, HER2/neu, and EpCAM. The expression levels measured by the μHD with magnetically labeled cells qualitatively matched expression levels measured by flow cytometry (inset) with fluorescently labeled cells. (B) Three different human cancer cell lines (A431, MDA-MB-468, MDA-MB-453) were screened for EpCAM using the μHD. Inset: flow cytometry measurements for the same three cell lines and EpCAM expression. (C) The linear correlation between μHD and flow cytometry data for a panel of human cancer cell lines (MDA-MB-453, MDA-MB-468, A431, and SkMG3) and for different biomarkers (EGFR, HER2/neu, EpCAM). Data are means ± SEM from 2000 VH values.
Figure 4. Evaluating the clinical utility of the μHD using tumor cells in vitro
(A) The μHD was insensitive to the background of unprocessed biological material. The tumor cell line MDA-MB-453 was profiled for EpCAM in human whole blood and in the presence of excess, free MNPs. Cells were measured in PBS (blue), whole blood (red), and PBS+excess MNPs (grey) with both μHD and flow cytometry. (B) The μHD was used to count rare cells in unprocessed whole blood samples. Flow cytometry was used to count cells in RBC-lysed blood samples. These values were compared to the expected cell counts. Data is displayed as mean ± SEM from triplicate measurements. (C) To simultaneously detect multiple biomarkers, cells were labeled with different types of MNPs, each targeting a different biomarker. The magnetic moments of the labeled cells were then measured by placing microfabricated Hall sensors in a spatially varying field (_B_1, _B_2, _B_3). (D) The measured magnetic moments m versus the applied field for MnFe2O4 MNPs with three different diameters (10, 12, and 16 nm). (E) The Hall voltages of cells labeled for all three cancer biomarkers were measured at varying applied field strengths. The magnetization curve (dotted line) is a fit using the magnetization curves of three different types of MnFe2O4 MNPs. Data are means ± SEM from 1000 VH values, SEM is insignificant compared to data. (F) Based on the magnetic moments measured at different fields as well as the known magnetic properties of each MNP, the number of each particle type could be calculated. MDA-MB-468 human cancer cells were labeled for three biomarkers: HER2/neu, EGFR, and EpCAM. The heat map compares the relative expression levels measured using flow cytometry (FCM), as well as separate and multiplexed measurements using the μHD.
Figure 5. Clinical applications of the μHD
(A) Circulating tumor cells (CTCs) in patient blood samples (n = 20) were detected using the μHD (top) as well as with the clinical gold-standard system, CellSearch (bottom). For the μHD, samples were magnetically targeted for four cancer biomarkers: EpCAM, HER2/neu, EGFR, and MUC1. The CellSearch detection was based on positive selection for EpCAM. (B) Ovarian cancer patients (n = 20) and healthy controls (n = 15) were screened by the μHD. The mean values of cell counts is shown as a dashed line. P < 0.01, two-sided t-test. (C) The receiver operating characteristic (ROC) curve for the μHD was generated from the data in (B). (D) EGFR expression was measured in cultured MDA-MB-468 tumor cells treated with various concentrations of geldanamycin. Western blot (top) and fluorescent microscopy (right) confirmed the results from flow cytometry. Human GAPDH was used as a control. (E) Rate of tumor growth in untreated mice and mice treated with geldanamycin. Data are normalized against the initial tumor volume when the treatment started (day 0). Data are means ± SEM (n = 3). (F) Mice bearing xenografted tumors were treated with geldanamycin for 6 days or left untreated (n = 6 per group). Tumor samples were screened by the μHD to monitor the temporal changes in EGFR expression. Data are means ± SEM. P < 0.05, two-sided t-test between days 1 and 6.
Comment in
- Circulating tumor cells: getting more from less.
Lang JM, Casavant BP, Beebe DJ. Lang JM, et al. Sci Transl Med. 2012 Jul 4;4(141):141ps13. doi: 10.1126/scitranslmed.3004261. Sci Transl Med. 2012. PMID: 22764205
Similar articles
- Point-of-care rare cell cancer diagnostics.
Issadore D. Issadore D. Methods Mol Biol. 2015;1256:123-37. doi: 10.1007/978-1-4939-2172-0_9. Methods Mol Biol. 2015. PMID: 25626536 Free PMC article. - Two-stage microfluidic chip for selective isolation of circulating tumor cells (CTCs).
Hyun KA, Lee TY, Lee SH, Jung HI. Hyun KA, et al. Biosens Bioelectron. 2015 May 15;67:86-92. doi: 10.1016/j.bios.2014.07.019. Epub 2014 Jul 14. Biosens Bioelectron. 2015. PMID: 25060749 - μHall chip for sensitive detection of bacteria.
Issadore D, Chung HJ, Chung J, Budin G, Weissleder R, Lee H. Issadore D, et al. Adv Healthc Mater. 2013 Sep;2(9):1224-8. doi: 10.1002/adhm.201200380. Epub 2013 Mar 12. Adv Healthc Mater. 2013. PMID: 23495188 Free PMC article. - Aptamers: Promising Tools for the Detection of Circulating Tumor Cells.
Hassan EM, Willmore WG, DeRosa MC. Hassan EM, et al. Nucleic Acid Ther. 2016 Dec;26(6):335-347. doi: 10.1089/nat.2016.0632. Epub 2016 Oct 13. Nucleic Acid Ther. 2016. PMID: 27736306 Review. - Toward Personalized Cancer Treatment: From Diagnostics to Therapy Monitoring in Miniaturized Electrohydrodynamic Systems.
Khondakar KR, Dey S, Wuethrich A, Sina AA, Trau M. Khondakar KR, et al. Acc Chem Res. 2019 Aug 20;52(8):2113-2123. doi: 10.1021/acs.accounts.9b00192. Epub 2019 Jul 11. Acc Chem Res. 2019. PMID: 31293158 Review.
Cited by
- Single-cell magnetic imaging using a quantum diamond microscope.
Glenn DR, Lee K, Park H, Weissleder R, Yacoby A, Lukin MD, Lee H, Walsworth RL, Connolly CB. Glenn DR, et al. Nat Methods. 2015 Aug;12(8):736-738. doi: 10.1038/nmeth.3449. Epub 2015 Jun 22. Nat Methods. 2015. PMID: 26098019 Free PMC article. - Magnetic fingerprints of rolling cells for quantitative flow cytometry in whole blood.
Reisbeck M, Helou MJ, Richter L, Kappes B, Friedrich O, Hayden O. Reisbeck M, et al. Sci Rep. 2016 Sep 6;6:32838. doi: 10.1038/srep32838. Sci Rep. 2016. PMID: 27596736 Free PMC article. - Tumor-selective replication herpes simplex virus-based technology significantly improves clinical detection and prognostication of viable circulating tumor cells.
Zhang W, Bao L, Yang S, Qian Z, Dong M, Yin L, Zhao Q, Ge K, Deng Z, Zhang J, Qi F, An Z, Yu Y, Wang Q, Wu R, Fan F, Zhang L, Chen X, Na Y, Feng L, Liu L, Zhu Y, Qin T, Zhang S, Zhang Y, Zhang X, Wang J, Yi X, Zou L, Xin HW, Ditzel HJ, Gao H, Zhang K, Liu B, Cheng S. Zhang W, et al. Oncotarget. 2016 Jun 28;7(26):39768-39783. doi: 10.18632/oncotarget.9465. Oncotarget. 2016. PMID: 27206795 Free PMC article. - Emerging role of nanomaterials in circulating tumor cell isolation and analysis.
Yoon HJ, Kozminsky M, Nagrath S. Yoon HJ, et al. ACS Nano. 2014 Mar 25;8(3):1995-2017. doi: 10.1021/nn5004277. Epub 2014 Mar 6. ACS Nano. 2014. PMID: 24601556 Free PMC article. Review. - Materials and microfluidics: enabling the efficient isolation and analysis of circulating tumour cells.
Jackson JM, Witek MA, Kamande JW, Soper SA. Jackson JM, et al. Chem Soc Rev. 2017 Jul 17;46(14):4245-4280. doi: 10.1039/c7cs00016b. Chem Soc Rev. 2017. PMID: 28632258 Free PMC article. Review.
References
- Brennan DJ, O’Connor DP, Rexhepaj E, Ponten F, Gallagher WM. Antibody-based proteomics: fast-tracking molecular diagnostics in oncology. Nat Rev Cancer. 2010;10:605–617. - PubMed
- Bendall SC, Simonds EF, Qiu P, Amir e-AD, Krutzik PO, Finck R, Bruggner RV, Melamed R, Trejo A, Ornatsky OI, Balderas RS, Plevritis SK, Sachs K, Pe’er D, Tanner SD, Nolan GP. Single-cell mass cytometry of differential immune and drug responses across a human hematopoietic continuum. Science. 2011;332:687–696. - PMC - PubMed
Publication types
MeSH terms
Grants and funding
- K12CA087723-10S2/CA/NCI NIH HHS/United States
- U54-CA119349/CA/NCI NIH HHS/United States
- T32 CA079443/CA/NCI NIH HHS/United States
- U01-HL080731/HL/NHLBI NIH HHS/United States
- U54 CA119349/CA/NCI NIH HHS/United States
- 2R01-EB004626/EB/NIBIB NIH HHS/United States
- R01 EB004626/EB/NIBIB NIH HHS/United States
- U01 HL080731/HL/NHLBI NIH HHS/United States
- P01 CA069246/CA/NCI NIH HHS/United States
- T32-CA79443/CA/NCI NIH HHS/United States
- HHSN268201000044C/HL/NHLBI NIH HHS/United States
LinkOut - more resources
Full Text Sources
Other Literature Sources
Research Materials
Miscellaneous


