Conditional expression of Parkinson's disease-related mutant α-synuclein in the midbrain dopaminergic neurons causes progressive neurodegeneration and degradation of transcription factor nuclear receptor related 1 - PubMed (original) (raw)
. 2012 Jul 4;32(27):9248-64.
doi: 10.1523/JNEUROSCI.1731-12.2012.
Loukia Parisiadou, Carmelo Sgobio, Guoxiang Liu, Jia Yu, Lixin Sun, Hoon Shim, Xing-Long Gu, Jing Luo, Cai-Xia Long, Jinhui Ding, Yolanda Mateo, Patricia H Sullivan, Ling-Gang Wu, David S Goldstein, David Lovinger, Huaibin Cai
Affiliations
- PMID: 22764233
- PMCID: PMC3417246
- DOI: 10.1523/JNEUROSCI.1731-12.2012
Conditional expression of Parkinson's disease-related mutant α-synuclein in the midbrain dopaminergic neurons causes progressive neurodegeneration and degradation of transcription factor nuclear receptor related 1
Xian Lin et al. J Neurosci. 2012.
Abstract
α-Synuclein (α-syn) plays a prominent role in the degeneration of midbrain dopaminergic (mDA) neurons in Parkinson's disease (PD). However, only a few studies on α-syn have been performed in the mDA neurons in vivo, which may be attributed to a lack of α-syn transgenic mice that develop PD-like severe degeneration of mDA neurons. To gain mechanistic insights into the α-syn-induced mDA neurodegeneration, we generated a new line of tetracycline-regulated inducible transgenic mice that overexpressed the PD-related α-syn A53T missense mutation in the mDA neurons. Here we show that the mutant mice developed profound motor disabilities and robust mDA neurodegeneration, resembling some key motor and pathological phenotypes of PD. We also systematically examined the subcellular abnormalities that appeared in the mDA neurons of mutant mice and observed a profound decrease of dopamine release, the fragmentation of Golgi apparatus, and the impairments of autophagy/lysosome degradation pathways in these neurons. To further understand the specific molecular events leading to the α-syn-dependent degeneration of mDA neurons, we found that overexpression of α-syn promoted a proteasome-dependent degradation of nuclear receptor-related 1 protein (Nurr1), whereas inhibition of Nurr1 degradation ameliorated the α-syn-induced loss of mDA neurons. Given that Nurr1 plays an essential role in maintaining the normal function and survival of mDA neurons, our studies suggest that the α-syn-mediated suppression of Nurr1 protein expression may contribute to the preferential vulnerability of mDA neurons in the pathogenesis of PD.
Figures
Figure 1.
Generation of PITX3-IRES2-tTA knock-in mice. A, The schematic diagram depicts the generation of PITX3-IRES2-tTA knock-in mice in which the IRES2-tTA expression cassette was inserted into the SacII site of PITX3 exon 4 immediately after the stop codon (asterisk) of the PITX3 gene. B, Southern blot of genomic DNA isolated from mouse embryonic stem (ES) cell clones shows a correct gene targeting of the PITX3 gene locus in ES cell clones 1E2 and 1F1. As predicted, the insertion of the IRES2-tTA-LNL gene-targeting cassette into the PITX3 gene locus generated a new 3.7 kb AflII fragment in clones 1E2 and 1F1 (arrowhead). C, A PCR assay shows the correct modification of the PITX3 allele through amplification of genomic DNA prepared from mouse tail biopsy. D, The quantification of PITX3 mRNA expression in the midbrain tissues dissected from 6-month-old nTg and PITX3-IRES2-tTA (tTA) heterozygous knock-in mice. The level of PITX3 mRNA expression was measured by qRT-PCR. Six or more mice were used for each genotype. E, The schematic diagram depicts the generation of PITX3-IRES2-tTA/tetO-H2Bj-GFP (H2GFP) double-transgenic mice. Sample images show the distribution of the nuclear localized H2Bj/GFP fusion protein in the midbrain coronal sections of 1-month-old H2GFP double-transgenic mice. The mDA neurons in both the SNC and VTA were revealed by immunostaining with an antiserum against TH. Scale bars: top, 100 μm; bottom, 50 μm. F, H2GFP (green) and TH (red) costaining in different brain regions. Scale bar, 100 μm.
Figure 2.
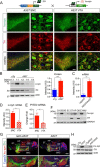
Target expression of PD-related human A53T α-syn in mDA neurons. A, The diagram depicts the generation of A53T inducible transgenic mice through crossbreeding PITX3-IRES2-tTA and tetO-A53T mice. Immunofluorescent images show the selective expression of human α-syn (hα-syn) in the mDA neurons at both the SNC and VTA regions of 1-month-old PITX3-IRES2-tTA/tetO-A53T (A53T) mice. The expression of human A53T α-syn (green) was revealed by an antiserum (syn211) specifically against hα-syn. The mDA neurons were visualized by TH immunostaining (red), and the nucleus was marked by Topro3 staining (blue). Scale bars: low-magnification images, 100 μm; high-magnification images, 10 μm. B, Western blot determines the level of α-syn overexpression in the midbrain homogenate from 1-month-old A53T transgenic mice compared with littermate nTg mice using an antiserum (C20) recognizing both human and mouse α-syn. A dilution series of midbrain homogenates from A53T mice were used for Western blot analysis. β-Actin (actin) and TH were used as the loading control. The Bar graph estimates the level of α-syn overexpression (normalized against the TH expression) in the midbrain of 1-month-old A53T mice compared with that of age-matched littermate nTg mice (n ≥ 3 per genotype). Data were presented as mean ± SEM. ***p < 0.001. **_C_**, qRT-PCR determines the levels of α-syn mRNA expression in isolated mDA neurons from 2-week-old _H2GFP_ and littermate _PITX3-IRES2-tTA/ tetO-H2Bj-GFP/tetO-A53T_ (_H2GFP/A53T_) transgenic mice (_n_ > 1000 cells per genotype). The primers for α-syn were designed to amplify both mouse and human α-syn. GAPDH was used to normalize the gene expression from different samples. Data were presented as mean ± SEM. **p < 0.01. **_D_**, **_E_**, qRT-PCR determines the levels of α-syn and _PITX3_ mRNA expression in isolated mDA neurons from the SNC and VTA of 2-week-old _H2GFP/A53T_ transgenic mice (_n_ > 1000 cells from SNC and VTA, respectively). GAPDH was used to normalize the gene expression from different samples. Data were presented as mean ± SEM. *p < 0.001. F, Regional distribution of hα-syn in the brain, eye, and skeletal muscle of 6-month-old A53T transgenic mice using a human α-syn-specific antibody (syn211). An equal amount of protein was loaded into each lane. GAPDH was used as the loading control. G, Images show staining of hα-syn (red), TH (green), and Topro3 (blue) in the sagittal section of 1-month-old tetO-A53T single-transgenic and A53T double-transgenic mice. Scale bars: top, 1 mm; bottom, 400 μm. H, Suppression of exogenous hα-syn expression in striatum homogenate from 1-month-old A53T mice treated with DOX starting from early embryonic stages. CX, Cerebral cortex; CB, cerebellum; BS, brainstem; SC, spinal cord; ST, striatum; HP, hippocampus; OB, olfactory bulb; EY, eye; MU, skeletal muscle; SNR: substantia nigra pars reticulate.
Figure 3.
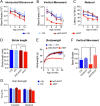
A53T α-syn inducible transgenic mice display profound motor disabilities. A, B, The horizontal movement (A) and vertical movement (B) of male A53T (n = 14) and control nTg (n = 12) mice as well as tetO-A53T (n = 13) and PITX3-IRES2-tTA (tTA; n = 13) single-transgenic mice were measured using the open-field test at 1, 2, 6, and 12 months of age. Data were presented as mean ± SEM. *p < 0.05; ***p < 0.001. C, The latency to fall was quantified by the rotarod test at 1, 2, 6, and 12 months of age for the same cohort of A53T and control mice used in A. Data were presented as mean ± SEM. *p < 0.05; ***p < 0.001. D, The stride length of 1-month-old male A53T and control mice (n ≥ 5 animals per genotype; n ≥ 20 strides per animal) was measured using the automatic TreadScan gait analysis system. Data were presented as mean ± SEM. *p < 0.05; **p < 0.01. E, Male A53T transgenic and control mice (n ≥ 10 animals per genotype) were weighed monthly for 20 months. Data were presented as mean ± SEM. ***p < 0.001. F, Vertical movements of 2-month-old A53T (n = 8) and control (Ctrl; including nTg, tTA, and tetO-A53T; n = 7) mice with regular chow compared with age-matched A53T (n = 6) and control (n = 5) mice with DOX-containing chow starting from earlier embryonic stages. Data were presented as mean ± SEM. *p < 0.05; **p < 0.01. G, The bar graph shows the grip strength of both the forelimb and hindlimb of 1-month-old male A53T (n = 10) and age-matched control nTg (n = 6) mice as well as tTA (n = 8) and tetO-A53T (n = 4) single-transgenic mice.
Figure 4.
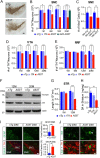
A53T α-syn inducible transgenic mice develop progressive and robust degeneration of mDA neurons. A, TH staining (brown puncta) of the midbrain coronal sections of 12-month-old A53T and littermate nTg mice. Scale bar, 100 μm. B, D, E, Numbers of TH-positive neurons remaining in the SNC (B), VTA (D), and RRF (_E) of A53T and control nTg mice as well as tTA single-transgenic mice at 1, 6, 12, and 20 mon_ths of age (n ≥ 3 per genotype per time point). B, The number of TH-positive neurons in the SNC of 20-month-old littermate tetO-A53T single-transgenic mice (n = 3) was also counted. Data were presented as mean ± SEM. *p < 0.05; **p < 0.01; ***p < 0.001. C, Numbers of Nissl-stained neurons in the SNC of 8- and 18-month-old A53T and nTg mice (n = 3 per genotype). Data were presented as mean ± SEM. *p < 0.05; **p < 0.01. F, Western blot analysis shows the expression levels of α-syn in the striatum homogenates of 12- and 20-month-old nTg and A53T mice using an antibody specific to human α-syn. G, Total length of TH-positive neurites in the striatum (STR) of A53T and nTg mice at 1 and 12 months of age (n = 3 per genotype). Data were presented as mean ± SEM. ***p < 0.001. H, Steady levels of DA in the striatum of 6-month-old nTg (n = 9), tTA (n = 8), and A53T (n = 11) mice. Data were presented as mean ± SEM. **p < 0.01. I, GFAP (green) and TH (red) costaining in the midbrain coronal sections of 20-month-old nTg and A53T mice. Scale bar, 100 μm. The bar graphs show the areas of SNC and substantia nigra pars reticulate (SNR) in 20-month-old nTg and A53T mice occupied by GFAP staining (n = 3 per genotype). Data were presented as mean ± SEM. *p < 0.05; **p < 0.01. J, Iba1 (green) and TH (red) costaining in the midbrain coronal sections of 20-month-old nTg and A53T mice. The arrowhead points to an activated microglia. Scale bar, 10 μm.
Figure 5.
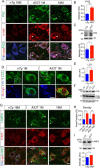
Subcellular distribution of A53T α-syn in the mDA neurons. A, α-syn (green) and TH (red) staining in the SNC of 12- and 18-month-old A53T and 12-month-old nTg mice. Topro3 (blue) staining was used to mark the nucleus. Scale bar, 10 μm. B, Western blot analysis shows the formation of α-syn-positive HMW bands in the midbrain homogenate of 1- and 18-month-old A53T and littermate control nTg mice. The bar graph indicates an increase of accumulation of HMW α-syn in the brain of A53T mice. Data were presented as mean ± SEM. **p < 0.01. C, Human α-syn (green) and TH (red) staining in the sagittal sections of globus pallidus of 1- and 12-month-old A53T and 12-month-old nTg mice. Arrowheads point to the swelling axon fragments. The nucleus was visualized by Topro3 (blue) staining. Scale bars: top, 50 μm; bottom, 10 μm. D, α-syn (green) and TH (red) staining in the striatum of 12-month-old nTg mice as well as 1- and 12-month-old A53T mice. The α-syn in A53T mice was revealed by staining with a human α-syn-specific antiserum (syn211). Arrowheads point to a swelling axon terminal. The nucleus was visualized by Topro3 (blue) staining. Scale bar, 10 μm.
Figure 6.
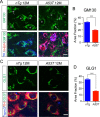
Overexpression of A53T α-syn perturbs the normal morphology of Golgi apparatus in the mDA neurons. A, GM130 (green), human α-syn (red), and TH (blue) costaining in the midbrain sections of 12-month-old nTg and A53T mice. Asterisks label TH-positive neurons. Arrows point to non-TH-positive cells. Scale bar, 10 μm. B, Percentage of cytoplasm area of TH-positive neurons covered by GM130 staining (n = 3 animals per genotype; n ≥ 18 neurons per animal). Data were presented as mean ± SEM. ***p < 0.001. C, GLG1 (green) and TH (red) costaining in the midbrain sections of 12-month-old nTg and A53T mice. Topro3 (blue) staining marked the nucleus. Scale bar, 10 μm. D, Percentage of cytoplasm area of TH-positive neurons covered by GLG1 staining (n = 3 animals per genotype; n ≥ 18 neurons per animal). Data were presented as mean ± SEM. ***p < 0.001.
Figure 7.
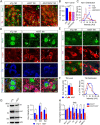
Overexpression of α-syn alters autophagosome and lysosome marker protein expression in the mDA neurons. A, P62 (green), α-syn (red), and TH (blue) costaining in the midbrain sections of 18-month-old nTg mice as well as 1- and 18-month-old A53T mice. Arrowheads point to areas with substantial overlap of P62 and α-syn staining. Scale bar, 10 μm. B, Quantification of P62 staining intensity in the TH-positive neurons of 1-month-old nTg and A53T mice (n = 3 animals per genotype; n ≥ 20 neurons per animal). Data were presented as mean ± SEM. ***p < 0.001. C, Western blot analysis shows the expression of P62 in the midbrain homogenate of 1-month-old A53T and littermate nTg mice. TH was used as loading control. The bar graph depicts the P62 expression levels normalized with TH in the midbrain homogenate of 1-month-old A53T and littermate nTg mice (n = 3 per genotype). Data were presented as mean ± SEM. *p < 0.05. D, LC3 (green), human α-syn (red), and TH (blue) costaining in the midbrain section of 1-month-old nTg and littermate A53T mice. Scale bars: low-magnification images, 50 μm; high-magnification images, 10 μm. E, The size of LC3-positive puncta in the TH-positive neurons of 1-month-old nTg and A53T mice (n = 3 animals per genotype; n ≥ 20 neurons per animal). Data were presented as mean ± SEM. *p < 0.05. F, Western blot shows the expression of LC3BI and LC3BII in the midbrain homogenate of 1-month-old A53T and nTg mice. G, LAMP2 (green), α-syn (red), and TH (blue) costaining in the midbrain sections of 1-month-old nTg and littermate A53T mice. Scale bar, 10 μm. H, Density of LAMP2-positive puncta in the TH-positive neurons of 1-month-old nTg and A53T mice (n = 3 animals per genotype; n ≥ 20 neurons per animal). Data were presented as mean ± SEM. ***p < 0.001. I, Western blot analysis shows the expression of LAMP2 in the midbrain homogenate of 1-month-old A53T and littermate nTg mice. TH was used as the loading control. The bar graph depicts the LAMP2 expression levels normalized with TH in the midbrain homogenate of 1-month-old A53T and littermate nTg mice (n = 3 per genotype). Data were presented as mean ± SEM. *p < 0.05.
Figure 8.
Ubiquitination in the midbrain of 18-month old nTg and A53T mice. A, Representative images show ubiquitin (Ubi, green), α-syn (red), and TH (blue) staining of midbrain coronal sections of 18-month-old nTg and A53T mice. Arrowheads point to TH-positive neurons with apparent accumulation of Ubi-positive aggregates. Asterisks indicate a TH-positive neuron with little Ubi staining. Scale bar, 10 μm. B, C, Bar graphs depict the measurement of Ubi staining intensity (B) and surface area (C) covered by Ubi staining in the mDA neurons of 18-month-old nTg and A53T mice (n = 3 animals per genotype; n ≥ 24 mDA neurons per animal). D, Western blot shows the Ubi-positive HMW bands in the Triton X-100 soluble (TX-sol) and insoluble (TX-insol) fractions of midbrain homogenates of 1- and 20-month-old nTg and A53T mice.
Figure 9.
Overexpression of A53T α-syn alters the morphology of mDA axon terminals. A, DAT (green) and TH (red) costaining in the striatum coronal sections from 1-month-old nTg and littermate A53T mice. Tropro3 was used to stain the nucleus (blue). Arrowheads marks a large swelling axon terminal. Scale bar, 10 μm. B, C, Size (B) and density (C) of DAT-labeled axon terminals in the striatum of 1-month-old nTg and A53T mice (n = 3 animals per genotype; n ≥ 4 sections per animal). Data were presented as mean ± SEM. *p < 0.05; ***p < 0.001.
Figure 10.
Overexpression of A53T α-syn impairs DA release. A, The graph shows the no-net-flux plot of gain/loss of dialysate DA concentration (_C_in − _C_out) related to DA concentration in the perfusate (_C_in). n = 6 per genotype. B, The no-net-flux X-intercept, considered as an average basal extracellular DA concentration, is reduced significantly in A53T mice. n = 6 per genotype. *p < 0.05. C, Effect of high potassium (60 m
m
KCl) perfusion on DA release differs significantly between groups. n = 6 per genotype. **p < 0.05. D) Representative DA traces (with cyclic voltammograms in inset) and color plots after a single-pulse stimulation (600 μA). In the color plots, the voltammetric current is encoded in color in _z_-axis and plotted against the applied potential (_y_-axis) and time (_x_-axis). E, The input/output curve of ex vivo voltammetry experiments shows a dramatic reduction of evoked DA release in A53T mice compared with nTg controls. n = 6 per genotype. *p < 0.05; **p < 0.01.
Figure 11.
Exogenous expression of A53T α-syn suppresses the nuclear accumulation of Nurr1 and the expression of Nurr1-controlled dopaminergic genes. A, Nurr1 (green) and TH (red) costaining in the SNC coronal sections of 1-month-old of nTg, A53T, and DOX-treated A53T (A53T/DOX) mice. Asterisks indicate TH-positive neurons with severe loss of Nurr1 staining. Arrows mark the mDA neurons with intensified Nurr1 staining. Arrowheads point to non-DA cells stained with Nurr1. Scale bar, 20 μm. B, Intensity of Nurr1 signals in the nucleus of SNC mDA neurons from 1-month-old nTg, A53T, and A53T/DOX mice (n ≥ 3 animals per genotype; n ≥ 40 neurons per animal). Data were presented as mean ± SEM. ***p < 0.001. **_C_**, The distribution of TH-positive mDA neurons with expression of various levels of Nurr1 in the SNC of 1-month-old _nTg_, _A53T_, and _A53T/DOX_ mice (_n_ ≥ 3 animals per genotype; _n_ ≥ 40 neurons per animal). **_D_**, Nurr1 (green), α-syn (red), and TH (blue) costaining in the midbrain sections of 1-month-old _nTg_ and _A53T_ mice. Asterisks mark TH-positive neurons with substantial somatic accumulation of α-syn. Arrowheads point to the Nurr1-expressing non-DA cells. Arrows indicate TH-positive neurons with little accumulation of α-syn in the soma. Scale bar, 10 μm. **_E_**, Nurr1 (green) and TH (red) costaining in the midbrain sections of 1-month-old _nTg_ and _A53T_ mice. Asterisks mark neurons with reduced expression of both Nurr1 and TH. Arrows point to neurons with increased Nurr1 and TH staining. **_F_**, The levels of TH staining in the soma of TH-positive mDA neurons of 1-month-old _nTg_ and _A53T_ mice. The line graph shows the distribution of TH signal intensities in the mDA neurons of 1-month-old _nTg_ and _A53T_ mice. Data were presented as mean ± SEM. ***_p_ < 0.001. **_G_**, Western blots show TH, DAT, and Ret expression in the striatum homogenate from 1-month-old _nTg_ and _A53T_ mice. Bar graphs quantify the relative expression levels of TH, DAT, and Ret in the striatum homogenate of 1-month old _nTg_ and _A53T_ mice. Data were presented as mean ± SEM. *_p_ < 0.05; **_p_ < 0.01. **_H_**, qRT-PCR determines the levels of _Nurr1_, _TH_, _DAT_, _VMAT2_, and _Ret_ mRNA expression in isolated mDA neurons from 2-week-old _H2GFP_ and littermate _H2GFP/A53T_ transgenic mice (_n_ > 1000 cells per genotype). GAPDH was used to normalize the gene expression from different samples. Data were presented as mean ± SEM. *p < 0.05; **p < 0.01.
Figure 12.
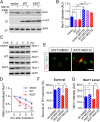
A53T α-syn promotes proteasome-dependent degradation of Nurr1 and inhibition of proteasome activities ameliorates A53T α-syn-induced loss of mDA neurons. A, Expression of endogenous Nurr1 protein in the HEK293 cells transfected with human WT or A53T α-syn cDNA. The transfected HEK293 cells were treated with either DMSO or 10 μ
m
MG132 for 12 h before being lysed for Western blot analysis. β-Actin was used as the loading control. B, The bar graph summarizes the expression of endogenous Nurr1 in α-syn-transfected HEK293 cells treated with DMSO or MG132, from three independent experiments. Data were presented as mean ± SEM. *p < 0.05; **p < 0.01. C, Expression of Nurr1 in human WT or A53T α-syn-transfected HEK293 cells treated with cycloheximide (CHX) for 2, 5, or 8 h before being subjected to Western blot analysis. β-Actin was used as a loading control. D, The line graph traces the decay of endogenous Nurr1 protein in empty vector or α-syn-transfected HEK293 cells from four independent experiments in which CHX was used to block protein synthesis for 2, 5, and 8 h. Data were presented as mean ± SEM. ***p < 0.001. E, Expression of Nurr1 (green) and TH (red) in the A53T midbrain cultures, treated with either DMSO or 10 n
m
MG132. Scale bar, 10 μm. F, Survival rate (percentage) of TH-positive neurons treated with DMSO or 10 n
m
MG132. Seven pairs of control and four pairs A53T cultures were analyzed for DMSO or MG132 treatment, respectively. For each culture, 200–500 TH-positive neurons were counted from four independent experiments. Data were presented as mean ± SEM. **p < 0.01. G, Levels of Nurr1 expression in the nucleus of TH-positive neurons in the A53T (n = 145 for DMSO; n = 140 for MG132) and littermate control (n = 117 for DMSO; n = 106 for MG132) cultures treated with either DMSO or MG132. Data were presented as mean ± SEM. *p < 0.05; **p < 0.01; ***p < 0.001.
Comment in
- Proteasomal inhibition as a treatment strategy for Parkinson's disease: the impact of α-synuclein on Nurr1.
Devine MJ. Devine MJ. J Neurosci. 2012 Nov 14;32(46):16071-3. doi: 10.1523/JNEUROSCI.4224-12.2012. J Neurosci. 2012. PMID: 23152591 Free PMC article. No abstract available. - Mechanisms for preferential dopaminergic cell loss induced by alpha-synuclein.
Engeln M. Engeln M. Mov Disord. 2012 Sep 15;27(11):1354. doi: 10.1002/mds.25178. Mov Disord. 2012. PMID: 23166926 No abstract available.
Similar articles
- NURR1 in Parkinson disease--from pathogenesis to therapeutic potential.
Decressac M, Volakakis N, Björklund A, Perlmann T. Decressac M, et al. Nat Rev Neurol. 2013 Nov;9(11):629-36. doi: 10.1038/nrneurol.2013.209. Epub 2013 Oct 15. Nat Rev Neurol. 2013. PMID: 24126627 Review. - A calcineurin- and NFAT-dependent pathway is involved in α-synuclein-induced degeneration of midbrain dopaminergic neurons.
Luo J, Sun L, Lin X, Liu G, Yu J, Parisiadou L, Xie C, Ding J, Cai H. Luo J, et al. Hum Mol Genet. 2014 Dec 15;23(24):6567-74. doi: 10.1093/hmg/ddu377. Epub 2014 Jul 22. Hum Mol Genet. 2014. PMID: 25051958 Free PMC article. - Intracerebral Administration of a Ligand-ASO Conjugate Selectively Reduces α-Synuclein Accumulation in Monoamine Neurons of Double Mutant Human A30P*A53T*α-Synuclein Transgenic Mice.
Pavia-Collado R, Cóppola-Segovia V, Miquel-Rio L, Alarcón-Aris D, Rodríguez-Aller R, Torres-López M, Paz V, Ruiz-Bronchal E, Campa L, Artigas F, Montefeltro A, Revilla R, Bortolozzi A. Pavia-Collado R, et al. Int J Mol Sci. 2021 Mar 13;22(6):2939. doi: 10.3390/ijms22062939. Int J Mol Sci. 2021. PMID: 33805843 Free PMC article. - Allelic difference in Mhc2ta confers altered microglial activation and susceptibility to α-synuclein-induced dopaminergic neurodegeneration.
Jimenez-Ferrer I, Jewett M, Tontanahal A, Romero-Ramos M, Swanberg M. Jimenez-Ferrer I, et al. Neurobiol Dis. 2017 Oct;106:279-290. doi: 10.1016/j.nbd.2017.07.016. Epub 2017 Jul 20. Neurobiol Dis. 2017. PMID: 28736195
Cited by
- α-Synuclein Up-regulates Monoamine Oxidase A Expression and Activity via Trans-Acting Transcription Factor 1.
Jia C, Cheng C, Li T, Chen X, Yang Y, Liu X, Li S, Le W. Jia C, et al. Front Aging Neurosci. 2021 Mar 17;13:653379. doi: 10.3389/fnagi.2021.653379. eCollection 2021. Front Aging Neurosci. 2021. PMID: 33815093 Free PMC article. - Autophagy alleviates neurodegeneration caused by mild impairment of oxidative metabolism.
Meng Y, Yong Y, Yang G, Ding H, Fan Z, Tang Y, Luo J, Ke ZJ. Meng Y, et al. J Neurochem. 2013 Sep;126(6):805-18. doi: 10.1111/jnc.12268. Epub 2013 Jun 9. J Neurochem. 2013. PMID: 23586593 Free PMC article. - NURR1 in Parkinson disease--from pathogenesis to therapeutic potential.
Decressac M, Volakakis N, Björklund A, Perlmann T. Decressac M, et al. Nat Rev Neurol. 2013 Nov;9(11):629-36. doi: 10.1038/nrneurol.2013.209. Epub 2013 Oct 15. Nat Rev Neurol. 2013. PMID: 24126627 Review. - An Efficient and Versatile System for Visualization and Genetic Modification of Dopaminergic Neurons in Transgenic Mice.
Tillack K, Aboutalebi H, Kramer ER. Tillack K, et al. PLoS One. 2015 Aug 20;10(8):e0136203. doi: 10.1371/journal.pone.0136203. eCollection 2015. PLoS One. 2015. PMID: 26291828 Free PMC article. - Damage of neuroblastoma cell SH-SY5Y mediated by MPP+ inhibits proliferation of T-cell leukemia Jurkat by co-culture system.
Wang F, Awan UF, Wang Y, Wang L, Qing H, Ma H, Deng Y. Wang F, et al. Int J Mol Sci. 2014 Jun 13;15(6):10738-50. doi: 10.3390/ijms150610738. Int J Mol Sci. 2014. PMID: 24933638 Free PMC article.
References
- Auluck PK, Caraveo G, Lindquist S. Alpha-synuclein: membrane interactions and toxicity in Parkinson's disease. Annu Rev Cell Dev Biol. 2010;26:211–233. - PubMed
- Baptista MJ, O'Farrell C, Daya S, Ahmad R, Miller DW, Hardy J, Farrer MJ, Cookson MR. Co-ordinate transcriptional regulation of dopamine synthesis genes by alpha-synuclein in human neuroblastoma cell lines. J Neurochem. 2003;85:957–968. - PubMed
- Betarbet R, Sherer TB, Greenamyre JT. Ubiquitin-proteasome system and Parkinson's diseases. Exp Neurol. 2005;191(Suppl 1):S17–S27. - PubMed
Publication types
MeSH terms
Substances
Grants and funding
- Z01 AG000959/ImNIH/Intramural NIH HHS/United States
- ZIA AG000945/ImNIH/Intramural NIH HHS/United States
- AG000945-03/AG/NIA NIH HHS/United States
- Z01 AG000945/ImNIH/Intramural NIH HHS/United States
- ZIA AG000959/ImNIH/Intramural NIH HHS/United States
- K07 AG000959/AG/NIA NIH HHS/United States
- ZIA AG000929/ImNIH/Intramural NIH HHS/United States
- AG000959-07/AG/NIA NIH HHS/United States
LinkOut - more resources
Full Text Sources
Other Literature Sources
Molecular Biology Databases
Research Materials
Miscellaneous

