MicroRNAs are exported from malignant cells in customized particles - PubMed (original) (raw)
MicroRNAs are exported from malignant cells in customized particles
Jaime Palma et al. Nucleic Acids Res. 2012 Oct.
Abstract
MicroRNAs (miRNAs) are released from cells in association with proteins or microvesicles. We previously reported that malignant transformation changes the assortment of released miRNAs by affecting whether a particular miRNA species is released or retained by the cell. How this selectivity occurs is unclear. Here we report that selectively exported miRNAs, whose release is increased in malignant cells, are packaged in structures that are different from those that carry neutrally released miRNAs (n-miRNAs), whose release is not affected by malignancy. By separating breast cancer cell microvesicles, we find that selectively released miRNAs associate with exosomes and nucleosomes. However, n-miRNAs of breast cancer cells associate with unconventional exosomes, which are larger than conventional exosomes and enriched in CD44, a protein relevant to breast cancer metastasis. Based on their large size, we call these vesicles L-exosomes. Contrary to the distribution of miRNAs among different microvesicles of breast cancer cells, normal cells release all measured miRNAs in a single type of vesicle. Our results suggest that malignant transformation alters the pathways through which specific miRNAs are exported from cells. These changes in the particles and their miRNA cargo could be used to detect the presence of malignant cells in the body.
Figures
Figure 1.
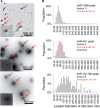
MiRNAs exported from breast cancer cells associate with a complex population of particles. (A) Particulate complexes collected from MDA-MB-231 cells grown in defined media were cleared of debris, filtered, collected by centrifugation at 70 000g (P70) and imaged by negative-stain EM. The preparation contains cup-shaped vesicles (as indicated by arrows) and structures of different shapes (arrowheads). (B) The largest diameter (ø) of >500 structures was measured and plotted. (C) A P70 preparation of MDA-MB-231 cells was subjected to buoyant sucrose gradient centrifugation for 18 h, and 1 ml gradient fractions (12, bottom of gradient, 1, top) were assayed for miRNA and CD81 abundance. The miRNA species of each gradient fraction were quantified using TaqMan qRT–PCR, and each miRNA species is plotted as a proportion of the fraction with maximum miRNA abundance, set at 1, and CD81 was measured using a dot blot probed with anti-CD81 antibody, and binding of a secondary goat-anti-mouse IgG-Alexa 488 was measured by fluorescence quantitation as described in Materials and Methods. A dot blot developed for secondary HRP antibody binding is shown below the graph. (D) Total small RNAs were visualized after 32P end-labeling and separation by native PAGE. 19–24 ntds: RNA species with expected size for miRNAs.
Figure 2.
Selectively exported MiRNAs associate with different complexes than commonly released MiRNAs. (A) P70 preparations of particles exported by MDA-MB-231 cells were separated by buoyant speed centrifugation for the indicated number of hours, and the miRNA species were measured using TaqMan qRT–PCR. Each miRNA species is plotted as a proportion of the fraction with maximum miRNA abundance, set at 1. (B) Plot of peak fractions in gradients from 0 to 100 h (∂exosomes indicated the gradient density expected of exosomes [1.13–1.19 g/ml,
Supplementary Figure 1
]). Buoyant velocity was as follows: neutrally released MiR-16 and miR-720: 0.78 and 1.0 cm/h, respectively. Selectively exported miRNA miR-451 and miR-1246: 0.04 and 0.2 cm/h, respectively, SYNTH RNA (0.01 cm/h). n = 4–12 for each point. Error bars: standard deviation from the mean. The black symbol represents naked SYNTH RNA added to the gradient. (C) Gradient fractions (12, bottom of gradient, 1, top) as in (A) were quantified for the abundance of an extracellular vesicle surface antigen, CD81 by dot blot, and the antigen abundance was measured using fluorescent quantitation. Data are plotted in (D). Colored arrows mark peak miRNA fractions as indicated in (A). CD81 is plotted as a proportion of the fraction with maximum CD81 abundance, set at 1. Colors correspond to the same miRNA species as in (A) (miR-16 blue, miR-451 red, miR-1246 green and miR-720 purple). The gray and the black traces are from two independent experiments.
Figure 3.
Selectively and neutrally exported MiRNAs associate with different particles. (A) Peak miRNA fractions of a 48-h gradient were subjected to negative EM staining. Arrows indicate the typical structures detected in these preparations, and magnified in insets. (B) A plot of the largest diameters of the structure population depicted in (A). At least 200 structures were quantified for each fraction.
Figure 4.
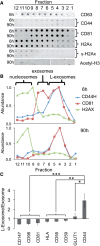
Large- and regular-sized exosomes; and nucleosomes have different proteins. (A) Fractions of 6- and 90-h gradients of P70s from MDA-MB-231 cells were probed for protein markers using quantitative dot-blot; or by western blot analysis for acetyl-H3 histone. (B) Quantitation of data in (A). (C) Comparison of abundance of exosome and L-exosome-associated antigens. *P < 0.05; **P < 0.01; ***P < 0.001, (n = 4). Bars represent standard deviation.
Figure 5.
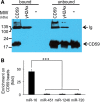
MiR-16 is enriched in CD59/PROTECTIN positive vesicles. Vesicle and particle sub-populations with CD59 or γ-H2Ax surface antigen were enriched by immunomagnetic separation. (A) Bound and remaining unbound populations of immunomagnetic beads were probed for CD59 recovery (top panel; – indicates naked beads incubated with P70. CD59 or γ-H2Ax indicates beads bound with these antibodies were incubated with P70). (B) MiRNA enrichment on beads was quantified using TaqMan qRT–PCR (bottom panel). Bars represent standard deviation (n = 4).
Figure 6.
MiR-1246 associates with nucleosomes. (A) MCF7 cells were probed for miR-1246 using miRCURY LNA probes (top panel) and for CD63 using antibodies (middle panel) and dyed for DNA (with DAPI, middle panel). Arrows indicate DAPI-negative regions of the nucleus (nucleoli). (B) Overlay of the individual probes. Green arrows indicate enriched miR-1246 populations, and red arrows indicate CD63 domains. (C) MDA-MB-231 cells were treated with etoposide, and cell death was quantified using trypan blue (n = 7). (D) Exported miR-1246 abundance was measured by TaqMan qRT–PCR. The two-tailed P value was calculated by paired T-test (n = 4). (E) Probing of P70 gradient fractions with H2Ax on untreated and etoposide-treated MDA-MB-231 cells.
Supplementary Figure S5
shows probing of these cells with an rRNA probe for comparison of subcellular location of these RNA species.
Figure 7.
Normal human fibroblasts export MiRNAs in a single vesicle family. (A) Normal donor skin fibroblasts were grown in defined media, a P70 preparation was produced and was subjected to buoyant velocity centrifugation for 6 h or (B) 92 h and probed for CD59, CD63 and HLA by dot blot and quantified. Inset in (A): EM of peak fraction 10 of 6 h gradient. Bar = 500 nm. (C) The largest diameter of >300 vesicles was measured and summarized. (D) Distribution of measured CD81 and miRNAs within gradient_, n_ = 2.
Figure 8.
MiRNAs associate with different complexes in human milk. (A) P70 was prepared from fresh human milk and subjected to buoyant velocity centrifugation for 6 or 48 h. (B) Negative stain EM of particles in major CD81 peak void of measured miRNAs. Arrows: electron-poor globules only detectable in the peak CD81 fractions. (C) Graph of largest diameters of particles of CD81 peak fraction. (D) The abundance of indicated miRNAs were measured in each gradient fraction after 6 h or 48 h of centrifugation by TaqMan qRT–PCR. (E) Negative stain EM of particles in major miRNA containing fraction after 6 or 48 h of gradient centrifugation.
Figure 9.
Characteristics of the major particles exported from breast cancer cells. Breast cancer cells export three families of particles containing miRNAs, L-exosomes, exosomes and dense spherical particles containing histones. Exosomes and L-exosomes contain many similar surface antigens, including CD63, an endosomal marker. However, exosomes and L-exosomes differ in the abundance of CD44, the vesicle size and the miRNA content. Sub-populations of these vesicles contain specific miRNAs. For example, miR-16, but none of the other miRNAs associate with CD59-positive vesicles. MiR-1246 associates with particles containing histones, which are void of vesicle surface markers. Interestingly, miRNAs that are selectively exported from malignant mammary epithelial cells are exported in exosomes and the spherical particles, but commonly released miRNAs miR-16 and miR-720 associate with L-exosomes. Non-canonical: miR-451 and miR-720 are processed non-canonically.
Similar articles
- Microvesicles secreted by macrophages shuttle invasion-potentiating microRNAs into breast cancer cells.
Yang M, Chen J, Su F, Yu B, Su F, Lin L, Liu Y, Huang JD, Song E. Yang M, et al. Mol Cancer. 2011 Sep 22;10:117. doi: 10.1186/1476-4598-10-117. Mol Cancer. 2011. PMID: 21939504 Free PMC article. - Evaluation of exosomal miR-9 and miR-155 targeting PTEN and DUSP14 in highly metastatic breast cancer and their effect on low metastatic cells.
Kia V, Paryan M, Mortazavi Y, Biglari A, Mohammadi-Yeganeh S. Kia V, et al. J Cell Biochem. 2019 Apr;120(4):5666-5676. doi: 10.1002/jcb.27850. Epub 2018 Oct 18. J Cell Biochem. 2019. PMID: 30335891 - Lipid-based carriers of microRNAs and intercellular communication.
Vickers KC, Remaley AT. Vickers KC, et al. Curr Opin Lipidol. 2012 Apr;23(2):91-7. doi: 10.1097/MOL.0b013e328350a425. Curr Opin Lipidol. 2012. PMID: 22418571 Free PMC article. Review. - Human Milk MicroRNAs/Exosomes: Composition and Biological Effects.
Lönnerdal B. Lönnerdal B. Nestle Nutr Inst Workshop Ser. 2019;90:83-92. doi: 10.1159/000490297. Epub 2019 Mar 13. Nestle Nutr Inst Workshop Ser. 2019. PMID: 30865991 - Effect of exosomal miRNA on cancer biology and clinical applications.
Sun Z, Shi K, Yang S, Liu J, Zhou Q, Wang G, Song J, Li Z, Zhang Z, Yuan W. Sun Z, et al. Mol Cancer. 2018 Oct 11;17(1):147. doi: 10.1186/s12943-018-0897-7. Mol Cancer. 2018. PMID: 30309355 Free PMC article. Review.
Cited by
- Aging and aging-associated diseases: a microRNA-based endocrine regulation hypothesis.
Umansky S. Umansky S. Aging (Albany NY). 2018 Oct 29;10(10):2557-2569. doi: 10.18632/aging.101612. Aging (Albany NY). 2018. PMID: 30375982 Free PMC article. - Comparisons of microRNA patterns in plasma before and after tumor removal reveal new biomarkers of lung squamous cell carcinoma.
Aushev VN, Zborovskaya IB, Laktionov KK, Girard N, Cros MP, Herceg Z, Krutovskikh V. Aushev VN, et al. PLoS One. 2013 Oct 9;8(10):e78649. doi: 10.1371/journal.pone.0078649. eCollection 2013. PLoS One. 2013. PMID: 24130905 Free PMC article. - Microvesicles transfer mitochondria and increase mitochondrial function in brain endothelial cells.
D'Souza A, Burch A, Dave KM, Sreeram A, Reynolds MJ, Dobbins DX, Kamte YS, Zhao W, Sabatelle C, Joy GM, Soman V, Chandran UR, Shiva SS, Quillinan N, Herson PS, Manickam DS. D'Souza A, et al. J Control Release. 2021 Oct 10;338:505-526. doi: 10.1016/j.jconrel.2021.08.038. Epub 2021 Aug 24. J Control Release. 2021. PMID: 34450196 Free PMC article. - Why the need and how to approach the functional diversity of extracellular vesicles.
Tkach M, Kowal J, Théry C. Tkach M, et al. Philos Trans R Soc Lond B Biol Sci. 2018 Jan 5;373(1737):20160479. doi: 10.1098/rstb.2016.0479. Philos Trans R Soc Lond B Biol Sci. 2018. PMID: 29158309 Free PMC article. Review. - Cells release subpopulations of exosomes with distinct molecular and biological properties.
Willms E, Johansson HJ, Mäger I, Lee Y, Blomberg KE, Sadik M, Alaarg A, Smith CI, Lehtiö J, El Andaloussi S, Wood MJ, Vader P. Willms E, et al. Sci Rep. 2016 Mar 2;6:22519. doi: 10.1038/srep22519. Sci Rep. 2016. PMID: 26931825 Free PMC article.
References
- Chen X, Liang H, Zhang J, Zen K, Zhang CY. Secreted microRNAs: a new form of intercellular communication. Trends Cell Biol. 2012;22:125–132. - PubMed
- Hata T, Murakami K, Nakatani H, Yamamoto Y, Matsuda T, Aoki N. Isolation of bovine milk-derived microvesicles carrying mRNAs and microRNAs. Biochem. Biophys. Res. Commun. 2010;396:528–533. - PubMed
- Luo SS, Ishibashi O, Ishikawa G, Ishikawa T, Katayama A, Mishima T, Takizawa T, Shigihara T, Goto T, Izumi A, et al. Human villous trophoblasts express and secrete placenta-specific microRNAs into maternal circulation via exosomes. Biol. Reprod. 2009;81:717–729. - PubMed
Publication types
MeSH terms
Substances
LinkOut - more resources
Full Text Sources
Other Literature Sources
Medical
Miscellaneous


