VEGF inhibits tumor cell invasion and mesenchymal transition through a MET/VEGFR2 complex - PubMed (original) (raw)
. 2012 Jul 10;22(1):21-35.
doi: 10.1016/j.ccr.2012.05.037.
Jeffrey P Chang, Christine A Parachoniak, Melissa M Pandika, Manish K Aghi, David Meyronet, Nadezda Isachenko, Shaun D Fouse, Joanna J Phillips, David A Cheresh, Morag Park, Gabriele Bergers
Affiliations
- PMID: 22789536
- PMCID: PMC4068350
- DOI: 10.1016/j.ccr.2012.05.037
VEGF inhibits tumor cell invasion and mesenchymal transition through a MET/VEGFR2 complex
Kan V Lu et al. Cancer Cell. 2012.
Abstract
Inhibition of VEGF signaling leads to a proinvasive phenotype in mouse models of glioblastoma multiforme (GBM) and in a subset of GBM patients treated with bevacizumab. Here, we demonstrate that vascular endothelial growth factor (VEGF) directly and negatively regulates tumor cell invasion through enhanced recruitment of the protein tyrosine phosphatase 1B (PTP1B) to a MET/VEGFR2 heterocomplex, thereby suppressing HGF-dependent MET phosphorylation and tumor cell migration. Consequently, VEGF blockade restores and increases MET activity in GBM cells in a hypoxia-independent manner, while inducing a program reminiscent of epithelial-to-mesenchymal transition highlighted by a T-cadherin to N-cadherin switch and enhanced mesenchymal features. Inhibition of MET in GBM mouse models blocks mesenchymal transition and invasion provoked by VEGF ablation, resulting in substantial survival benefit.
Copyright © 2012 Elsevier Inc. All rights reserved.
Figures
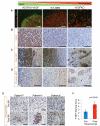
Figure 1. VEGF Expression is Inversely Correlated with Perivascular Invasion and MET Phosphorylation
(A) Tumors from intracranial implantion of indicated murine GBM cells were fluorescently stained for SV40 Large T-Antigen and CD31 to detect tumor cells and vasculature, respectively. Scale bars, 200 μm. (B-D) IHC staining for VEGF (B), total MET (C), and phospho-MET (D) in orthotopic murine GBM. Scale bars, 100 μm. (E) IHC staining for phospho-MET in paired human GBM surgical specimens before and after bevacizumab (BV) treatment. Scale bars, 50 μm. (F) P-MET staining score (mean±SEM) of 10 human GBM before and after bevacizumab treatment based on a composite score as described in Supplemental Experimental Procedures. See also Figure S1.
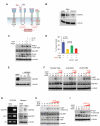
Figure 2. VEGF Suppresses HGF-stimulated MET Phosphorylation and Cell Motility
(A) Western blot analysis of cell lysates from murine VEGFKO cells stimulated with various concentrations of HGF and/or VEGF for P-MET, total MET, and P-FAK. VEGFKO cells were also incubated with their own (KO) or VEGFKO-VEGF cells (VEGF) conditioned media (CM). α-tubulin was used for loading control. (B) Western blot analysis of human primary GBM43 cells treated with HGF and/or VEGF for P-MET, total MET, P-FAK, and α-tubulin. (C) Western blot analysis of human GBM43 cells treated with B20 and stimulated with HGF and/or VEGF. (D) Wound-healing assay of HGF-stimulated VEGFKO cells or VEGFKO-VEGF cells. VEGFKO cells were treated with either exogenous VEGF or CM from VEGFKO-VEGF cells (VEGF CM). Top, quantification of wound closure (mean±SEM). p-values compared to VEGFKO cells stimulated with HGF only. Bottom, representative images of wounded cell monolayers. Scale bars, 150μm. (E) Wound-healing assay of GBM43 cells treated with exogenous VEGF, VEGF CM, and VEGFKO CM (mean±SEM). p-values compared to GBM43 cells stimulated with HGF only. See also Figure S2.
Figure 3. VEGFR2 is Required for VEGF to Suppress HGF-stimulated MET Phosphorylation and Cell Motility
(A) Schematic of possible ways by which VEGF can block MET activation. (B) Western blot analysis detecting relative VEGFR2 expression in GBM43 and VEGFKO tumor cells. Human microvascular endothelial cells (HMEC) were used as a positive control. (C) VEGFKO cells stimulated with HGF or VEGF as indicated were treated with 100 μg/ml of DC101 or 100 μg/ml of MF1 and lysates subjected to immunoblotting. (D) Motility of VEGFKO cells incubated with VEGF CM and treated with either 100 μg/ml DC101 or MF1 was assessed in the wound-healing assay (mean±SEM). (E) Western blot analysis showing stable knockdown of VEGFR2 in VEGFKO cells transduced with VEGFR2 shRNA (shVR2). Parental control cells (Ctl) and a scrambled shRNA sequence (Scr) are also shown. HMEC were used as a positive control. (F) Parental VEGFKO cells or VEGFKO cells transduced with scrambled shRNA or shRNA targeting VEGFR2 were stimulated with HGF and/or VEGF and subjected to immunoblotting as indicated. (G) RT-PCR and western blot analyses for VEGFR2 and MET expression in HEK293T fibroblasts. HMEC served as positive control for VEGFR2 expression. L19 and α-tubulin were loading controls for RT-PCR and western blot, respectively. (H) HEK293T cells stimulated with HGF and indicated concentrations of VEGF were subjected to western blot analysis as indicated. (I) Western blot analysis of VEGFKO cells stimulated with HGF or VEGF121 as indicated. See also Figure S3.
Figure 4. MET and VEGFR2 Associate in a Heterocomplex
(A) Co-immunoprecipitation (IP) of endogenous VEGFR and MET in two primary human GBM cultures (SF7796 and SF8161) as visualized by IP of VEGFR2 followed by immunoblotting for VEGFR2 and MET. Whole cell lysates from HMEC and human primary GBM43 cells overexpressing VEGFR2 by adenoviral transduction (GBM43 WT-VR2) were run alongside as positive controls. (B-C) Murine VEGFKO cells (B) or GBM43 cells (C) transduced by adenovirus to overexpress HA-tagged WT-VEGFR2 or Δ450C-VEGFR2 with or without stimulation of HGF or VEGF as indicated were lysed and immunoprecipitated using indicated antibodies and the immunoprecipitates then immunoblotted as indicated. (D-E) Representative images of PLA in murine VEGFKO (D) or human GBM43 (E) cells expressing WT-VEGFR2 or Δ450C-VEGFR2 after treatment with the indicated growth factors. Red spots are regions of signal amplification denoting VEGFR2 and MET interaction. Cytoskeletal staining (FITC-phalloidin) is green, and nuclear stain (DAPI) is blue. Scale bars, 20 μm. (F-G) Quantification of PLA signals in murine VEGFKO (F) and human GBM43 (G) cells transduced with WT-VEGFR2 (mean±SEM).
Figure 5. VEGF Signaling Increases PTP1B Recruitment to MET
(A) Control GBM43 cells, GBM43 cells treated with sodium orthovanadate (Na3VO4) for 30 min, or GBM43 cells transfected with PTP1B siRNA were stimulated with HGF, VEGF, or both ligands at the concentrations indicated and lysates analyzed by western blot for P-MET, total MET, and PTP1B. (B) GBM43 cells stimulated with HGF and/or VEGF were crosslinked with the membrane-permeable and cleavable cross-linker DSP and 250 μg of each lysate immunoprecipitated with an anti-MET antibody, followed by immunoblotting for MET and PTP1B. GBM43 whole cell lysate served as a positive control for analysis of the immunoprecipitates. (C) Representative images of immunofluorescent staining of GBM43 cells treated with HGF and/or VEGF for MET (red), EEA-1 (green), and DAPI (blue). ROI: higher magnification of the indicated area. Arrows indicate co-localization of MET and EEA-1-positive vesicles. Scale bar = 10 μm. (D) Quantification of co-localization between MET and EEA-1 staining (mean±SEM). See also Figure S4.
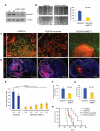
Figure 6. MET Knockdown Blocks Tumor Invasion and Promotes Survival of VEGF-deficient Tumors
(A) Immunoblot analysis of MET expression in VEGFKO cells stably transduced with two independent shRNAs targeting MET. Parental VEGFKO cells (Ctl) and VEGFKO cells transduced with a scrambled shRNA (Scr) are also shown. (B) Representative images (left) and quantification (right, mean±SEM) of a wound-healing assay comparing migration of VEGFKO-shMET1 cells to VEGFKO cells. Dashed white lines indicate edge of wound. Scale bar, 100 μm. (C-D) Immunohistochemical staining of intracranial VEGFKO, VEGFKO-scrambled, and VEGFKO-shMET1 tumors with SV40 large T-antigen (red) and CD31 (green) (C), or with SV40 large T-antigen (red) and DAPI (blue) (D), to visualize tumor cells and vasculature, respectively. Yellow boxes in (D) (scale bar, 1 mm) represent the region of magnification shown in (C) (scale bar, 200 μm). Images are representative of time-matched samples 23 days post-implantation. (E) Quantification of total invasion from the primary tumor mass in VEGFKO or VEGFKO-shMET1 tumors over various time points (mean±SEM). The number of mice analyzed for each condition and time point is indicated. (F-G) Proliferation (F) and vessel density (G) in orthotopic VEGFKO and VEGFKO-shMET1 tumors 23 days after tumor inoculation as determined by phospho-histone H3 and CD31 staining, respectively (mean±SEM). (H) Kaplan-Meier survival curves of mice intracranially implanted with WT-GBM, VEGFKO, VEGFKO-scrambled, and VEGFKO-shMET1 cells. p=0.007 for VEGFKO-shMET1 vs. VEGFKO-scramble. See also Figure S5.
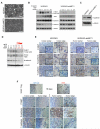
Figure 7. HGF/MET Signaling Induces an EMT-like Transition in GBM
(A) Representative phase contrast microscopy images of VEGFKO and VEGFKO-shMET1 cells. Scale bars, 100 μm. (B) Immunoblot analysis of VEGFKO or VEGFKO-shMET1 cells stimulated with HGF for the indicated times for P-Met, Snail, N-cadherin, and T-cadherin expression. (C) Immunoblot analysis of T-cadherin expression in VEGFKO-shMET1 cells and parental VEGFKO cells. (D) Immunoblot analysis of VEGFKO cell lysates 6 hours after stimulation with HGF or indicated concentrations of VEGF. (E-F) Immunohistochemical staining of intracranial mouse GBMs for P-MET, N-cadherin, and T-cadherin (brown). Sections were counterstained with hematoxylin (blue). Staining at the center of the main tumor mass or at the tumor rim is shown as indicated. (E) Representative images of time-matched (day 27) VEGFKO and VEGFKO-shMET1 tumors. Dashed lines indicate the smooth border of VEGFKO-shMET1 tumors. (F) Mice bearing orthotopic WT-GBM were treated with B20 or vehicle beginning 3 days after tumor implantation. Representative staining of tumors from mice sacrificed 16 days after tumor implantation are shown. Tumor cells were visualized by staining for SV40 Tag (top). Scale bars, 50 μm. See also Figure S6.
Figure 8. Bevacizumab-Resistant Human GBM Exhibit Increased P-MET and Expression of Mesenchymal Markers
(A-B) Paired human GBM samples obtained before and after treatment with bevacizumab (BV) were immunohistochemically stained for P-MET and N-cadherin (brown) and counterstained with hematoxylin (blue) (A). Representative images of staining from the same area of serial sections are shown. Tissues were also fluorescently co-stained for the mesenchymal markers vimentin (green) and CD44 (red) and nuclei visualized with DAPI (blue) (A-B). Scale bars, 50 μm. (C) Staining scores (mean±SEM) of the mesenchymal markers vimentin, CD44, and YKL-40 in paired human GBM specimens before and after BV. Each sample was scored on a scale of 0-3 and the number of paired patient samples analyzed for marker indicated.
Comment in
- Receptor talk and tumor cell walk in glioblastoma.
Claesson-Welsh L. Claesson-Welsh L. Cancer Cell. 2012 Jul 10;22(1):1-2. doi: 10.1016/j.ccr.2012.06.011. Cancer Cell. 2012. PMID: 22789531 - Migration: VEGF suppresses invasion.
McCarthy N. McCarthy N. Nat Rev Cancer. 2012 Sep;12(9):581. doi: 10.1038/nrc3345. Epub 2012 Aug 2. Nat Rev Cancer. 2012. PMID: 22854837 No abstract available. - RTK inhibition: looking for the right pathways toward a miracle.
Xie Q, Vande Woude GF, Berens ME. Xie Q, et al. Future Oncol. 2012 Nov;8(11):1397-400. doi: 10.2217/fon.12.130. Future Oncol. 2012. PMID: 23148613
Similar articles
- Super-enhancer-driven LIF promotes the mesenchymal transition in glioblastoma by activating ITGB2 signaling feedback in microglia.
Xie H, Jiang Y, Xiang Y, Wu B, Zhao J, Huang R, Wang M, Wang Y, Liu J, Wu D, Tian D, Bian E. Xie H, et al. Neuro Oncol. 2024 Aug 5;26(8):1438-1452. doi: 10.1093/neuonc/noae065. Neuro Oncol. 2024. PMID: 38554116 - Antiangiogenic therapy for high-grade glioma.
Khasraw M, Ameratunga MS, Grant R, Wheeler H, Pavlakis N. Khasraw M, et al. Cochrane Database Syst Rev. 2014 Sep 22;(9):CD008218. doi: 10.1002/14651858.CD008218.pub3. Cochrane Database Syst Rev. 2014. PMID: 25242542 Updated. Review. - Sexual-biased necroinflammation is revealed as a predictor of bevacizumab benefit in glioblastoma.
Hiller-Vallina S, Mondejar-Ruescas L, Caamaño-Moreno M, Cómitre-Mariano B, Alcivar-López D, Sepulveda JM, Hernández-Laín A, Pérez-Núñez Á, Segura-Collar B, Gargini R. Hiller-Vallina S, et al. Neuro Oncol. 2024 Jul 5;26(7):1213-1227. doi: 10.1093/neuonc/noae033. Neuro Oncol. 2024. PMID: 38411438 Free PMC article. - Anti-angiogenic therapy for high-grade glioma.
Ameratunga M, Pavlakis N, Wheeler H, Grant R, Simes J, Khasraw M. Ameratunga M, et al. Cochrane Database Syst Rev. 2018 Nov 22;11(11):CD008218. doi: 10.1002/14651858.CD008218.pub4. Cochrane Database Syst Rev. 2018. PMID: 30480778 Free PMC article. - Unraveling the noncoding RNA landscape in glioblastoma: from pathogenesis to precision therapeutics.
Sandhanam K, Tamilanban T. Sandhanam K, et al. Naunyn Schmiedebergs Arch Pharmacol. 2024 Dec;397(12):9475-9502. doi: 10.1007/s00210-024-03265-7. Epub 2024 Jul 15. Naunyn Schmiedebergs Arch Pharmacol. 2024. PMID: 39007929 Review.
Cited by
- Fighting the force: Potential of homeobox genes for tumor microenvironment regulation.
Northcott JM, Northey JJ, Barnes JM, Weaver VM. Northcott JM, et al. Biochim Biophys Acta. 2015 Apr;1855(2):248-53. doi: 10.1016/j.bbcan.2015.03.004. Epub 2015 Mar 24. Biochim Biophys Acta. 2015. PMID: 25818365 Free PMC article. Review. - Glioblastoma resistance to anti-VEGF therapy: has the challenge been MET?
McCarty JH. McCarty JH. Clin Cancer Res. 2013 Apr 1;19(7):1631-3. doi: 10.1158/1078-0432.CCR-13-0051. Epub 2013 Feb 12. Clin Cancer Res. 2013. PMID: 23403631 Free PMC article. - Mechanisms of evasive resistance to anti-VEGF therapy in glioblastoma.
Lu KV, Bergers G. Lu KV, et al. CNS Oncol. 2013 Jan;2(1):49-65. doi: 10.2217/cns.12.36. CNS Oncol. 2013. PMID: 23750318 Free PMC article. Review. - Mesenchymal Epithelial Transition Factor Signaling in Pediatric Nervous System Tumors: Implications for Malignancy and Cancer Stem Cell Enrichment.
Khater AR, Abou-Antoun T. Khater AR, et al. Front Cell Dev Biol. 2021 May 13;9:654103. doi: 10.3389/fcell.2021.654103. eCollection 2021. Front Cell Dev Biol. 2021. PMID: 34055785 Free PMC article. Review. - Vascular co-option in resistance to anti-angiogenic therapy.
Ribatti D, Annese T, Tamma R. Ribatti D, et al. Front Oncol. 2023 Dec 11;13:1323350. doi: 10.3389/fonc.2023.1323350. eCollection 2023. Front Oncol. 2023. PMID: 38148844 Free PMC article. Review.
References
- Adachi Y, Takeuchi T, Nagayama T, Ohtsuki Y, Furihata M. Zeb1-mediated T-cadherin repression increases the invasive potential of gallbladder cancer. FEBS Lett. 2009;583:430–436. - PubMed
- Ades EW, Candal FJ, Swerlick RA, George VG, Summers S, Bosse DC, Lawley TJ. HMEC-1: establishment of an immortalized human microvascular endothelial cell line. J. Invest. Dermatol. 1992;99:683–690. - PubMed
- Andreeva AV, Kutuzov MA. Cadherin 13 in cancer. Genes Chromosomes Cancer. 2010;49:775–790. - PubMed
Publication types
MeSH terms
Substances
Grants and funding
- R01CA113382/CA/NCI NIH HHS/United States
- U54CA163155/CA/NCI NIH HHS/United States
- CTP-79857/CAPMC/ CIHR/Canada
- R01CA099948/CA/NCI NIH HHS/United States
- T32 CA108462/CA/NCI NIH HHS/United States
- R01 CA113382/CA/NCI NIH HHS/United States
- K02 NS064167/NS/NINDS NIH HHS/United States
- R01 CA099948/CA/NCI NIH HHS/United States
- U54 CA163155/CA/NCI NIH HHS/United States
LinkOut - more resources
Full Text Sources
Other Literature Sources
Medical
Molecular Biology Databases
Research Materials
Miscellaneous


