The ALK(F1174L) mutation potentiates the oncogenic activity of MYCN in neuroblastoma - PubMed (original) (raw)
. 2012 Jul 10;22(1):117-30.
doi: 10.1016/j.ccr.2012.06.001.
William Luther, Namrata Bhatnagar, Yann Jamin, Evon Poon, Takaomi Sanda, Desheng Pei, Bandana Sharma, Winston R Vetharoy, Albert Hallsworth, Zai Ahmad, Karen Barker, Lisa Moreau, Hannah Webber, Wenchao Wang, Qingsong Liu, Antonio Perez-Atayde, Scott Rodig, Nai-Kong Cheung, Florence Raynaud, Bengt Hallberg, Simon P Robinson, Nathanael S Gray, Andrew D J Pearson, Suzanne A Eccles, Louis Chesler, Rani E George
Affiliations
- PMID: 22789543
- PMCID: PMC3417812
- DOI: 10.1016/j.ccr.2012.06.001
The ALK(F1174L) mutation potentiates the oncogenic activity of MYCN in neuroblastoma
Teeara Berry et al. Cancer Cell. 2012.
Abstract
The ALK(F1174L) mutation is associated with intrinsic and acquired resistance to crizotinib and cosegregates with MYCN in neuroblastoma. In this study, we generated a mouse model overexpressing ALK(F1174L) in the neural crest. Compared to ALK(F1174L) and MYCN alone, co-expression of these two oncogenes led to the development of neuroblastomas with earlier onset, higher penetrance, and enhanced lethality. ALK(F1174L)/MYCN tumors exhibited increased MYCN dosage due to ALK(F1174L)-induced activation of the PI3K/AKT/mTOR and MAPK pathways, coupled with suppression of MYCN pro-apoptotic effects. Combined treatment with the ATP-competitive mTOR inhibitor Torin2 overcame the resistance of ALK(F1174L)/MYCN tumors to crizotinib. Our findings demonstrate a pathogenic role for ALK(F1174L) in neuroblastomas overexpressing MYCN and suggest a strategy for improving targeted therapy for ALK-positive neuroblastoma.
Copyright © 2012 Elsevier Inc. All rights reserved.
Figures
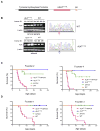
Figure 1. Overexpression of ALKF1174L Potentiates the Oncogenic Activity of MYCN In Vivo
(A) The ALKF1174L cDNA was ligated 3′ to the rat Th promoter to generate the p4.5 Th_-ALKF1174L_ transgenic construct (_Th_-ALKF1174L). (B) RT-PCR analysis of ALK expression in cervical ganglia and adrenal glands of 7 to 10-day-old WT mice (M1–M3) or mice transgenic for ALKF1174L (M4–M6) (left panels). Spl, spleen. Electropherogram showing the change in the phenylalanine codon (TTC) in WT ALK to leucine (CTC) in the ALKF1174L mutation in ganglia (right panel). (C–D) Kaplan-Meier survival curves of founder lines resulting from intercrosses of Th-ALKF1174L mice and _Th_-MYCN mice. (C) Founder 2 - ALKF1174L/MYCN, n=31; MYCN, n=9; ALKF1174L, n=4; WT, n=5. Founder 4 - ALKF1174L/MYCN, n=25; MYCN, n=20; ALKF1174L, n=13; WT, n=6. (D) Founder 1 - ALKF1174L/MYCN, n=12; MYCN, n=6; ALKF1174L, n=12; WT, n=3. Founder 3 - ALKF1174L/MYCN, n=11; MYCN, n=10; ALKF1174L, n=11; WT, n=5. See also Figure S1.
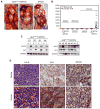
Figure 2. Combined Overexpression of ALKF1174L and MYCN Results in Multifocal Neuroblastomas
(A) Gross appearance of representative ALKF1174L/MYCN and MYCN tumors. Tumors (*) arise as multifocal primary lesions in ALK F1174L/MYCN animals: thoracic paraspinous (left panel) and abdominal (right panel) tumors. K, kidney, L, liver, Lu, Lung. (B) Quantitative RT-PCR analysis of murine and human ALK expression in spleen, adrenal glands and tumors from ALKF1174L/MYCN or MYCN mice. Error bars indicate mean values ± 95% confidence interval (CI). (C) Immunoblotting of ALK F1174L/MYCN tumors (T, M1–M6) for ALK, MYCN (left panel) and pALK (right panel). pALK was detected using a human-specific ALKY1604 antibody. Matched spleens (S) were used as negative controls and GAPDH was used as a loading control. (D) Hematoxylin and eosin (H&E) and immunohistochemical staining for ALK and MYCN of representative ALK F1174L/MYCN murine and human neuroblastoma tumor sections. Scale bars, 20μm, insets 5μm. See also Figure S2.
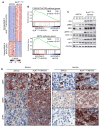
Figure 3. ALKF1174L/MYCN Tumors Exhibit Distinct Expression Profiles and Downstream Signaling Compared to MYCN Tumors
(A) Heat map representation of differentially regulated genes in ALK F1174L/MYCN vs. MYCN tumors (fold change ≥2.0; corrected p-value < 0.05). (B) Gene set enrichment analysis of PI3K/AKT/mTOR and MAPK pathway genes in transcriptional profiles of ALK F1174L/MYCN and MYCN tumors. The normalized enrichment score (NES) and the nominal p-value are indicated. (C) Immunoblotting of PI3K/AKT/mTOR and MAPK signaling pathways in ALK F1174L/MYCN and MYCN tumors. (D) Immunohistochemical staining for PI3K/AKT/mTOR (pS6K) and MAPK (pMEK and pERK) pathways in ALK F1174L/MYCN and MYCN murine and human tumors (Scale bars, 10 μm). See also Figure S3.
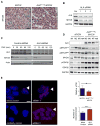
Figure 4. ALK F1174L Enhances MYCN Protein Stabilization
(A) Immunohistochemical staining for MYCN in ALK F1174L/MYCN and MYCN tumors. Scale bars, 20μm. (B) Western blot analysis of MYCN protein in Kelly human neuroblastoma cells after ALKF1174L knockdown using three different siRNAs (1, 2, and 3). Ctl, cells expressing a control siRNA. (C) Western blot analysis of MYCN protein expression in Kelly cells transfected with an ALK or control shRNA followed by treatment with 25 μmol/L of cycloheximide (CHX) and harvested at the indicated time points. (D) Immunoblotting of ALK F1174L/MYCN and MYCN tumors for pMYCNS62, pMYCNT58 and pGSK3β (upper panel). Graph (lower panel) depicts quantification of pMYCNT58 expression in the two types of tumors. *p = 0.05 by unpaired t-test. (E) In situ detection of MYCN:FBXW7 complex formation (arrowheads) in untreated Kelly cells (mock control), ALKF1174L-depleted cells (siRNAs 1 & 3), or cells probed with secondary antibody only as a negative control (antibody control). Quantification of the number of MYCN:FBXW7 interactions in untreated Kelly cells and ALKF1174L-depleted Kelly cells (right panel). Data are presented as means ± standard deviation (SD). ***p = 0.009 (Student’s t-test).
Figure 5. ALK F1174L Induces Expression of Endogenous Murine MYCN
(A) Heat map representing the top 50 upregulated genes (corrected p-value < 0.05, fold change ≥ 2.0) in ALK F1174L/MYCN tumors compared with MYCN tumors. (B) qRT-PCR analysis of murine and human MYCN expression in adrenal glands and tumors from ALKF1174L/MYCN and MYCN mice. Expression is relative to either murine or human MYCN levels in tumors from MYCN heterozygotic mice. Mean values ± 95% CI are indicated. (C) Fluorescence in situ (FISH) analysis of murine ALK F1174L/MYCN tumors using an ALK dual-color break-apart probe (upper panel) and a MYCN probe (lower panel) (Scale bar, 10μm). (D) qRT-PCR analysis of ALK F1174L and MYCN expression in Kelly cells in which ALKF1174L expression was depleted using shRNA, compared with cells in which a control shRNA was used. Western blot showing level of ALKF1174L knockdown (inset). Means ± SEM values for 3 independent experiments are shown. Ctl, cells expressing a control shRNA.
Figure 6. ALKF1174L Promotes Anti-apoptotic Activity in ALKF1174L/MYCN Neuroblastomas
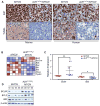
(A) Immunohistochemical staining for Ki67 and TUNEL of transgenic murine and human ALK F1174L/MYCN and MYCN neuroblastomas. Scale bars, 20μm. (B) Heat map representation of the expression levels of pro-survival genes, Bcl2 and Bclw, and the pro-apoptotic genes Bak, Bax, Bik, Bid, Noxa and Trp53, in ALK F1174L/MYCN and MYCN tumors. (C) qRT-PCR analysis of Bclw and Bid expression in ALK F1174L/MYCN and MYCN tumors (n=10 in each group). Gene expression is relative to that in a MYCN tumor. Data are presented as mean ± SEM. (*p = 0.03, ** p = 0.005). (D) Immunoblotting of ALKF1174L/MYCN and MYCN tumors depicting expression of BCLW, BCL2 and BID proteins in the ALKF1174L/MYCN and MYCN tumors. See also Figure S4.
Figure 7. Combined Targeting of ALKF1174L and mTOR is Effective against ALKF1174L/MYCN Neuroblastomas
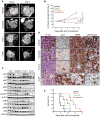
(A) MRI images depicting a representative tumor response to vehicle or crizotinib (100 mg/kg) and Torin2 (20 mg/kg) as single agents or in combination (at single-agent doses) after 7 days of treatment. Comb, combination treatment. (B) Quantitation of changes in tumor volume in animals treated with crizotinib, Torin2, or combination therapy as measured by MRI on days 0, 3 and 7. Data are presented as means ± SEM (4 animals per treatment group). Crizotinib vs. combination, **p = 0.003; Torin2 vs. combination; ****p = 0.0002; vehicle vs. combination, **p=0.002; all by student’s t-test. (C) Western blot analysis of the indicated proteins in ALK F1174L/MYCN tumors in panels (A) and (B). Veh, vehicle; Comb, combination. (D) H&E and immunohistochemical staining of tumors in (A) and (B) as indicated. Comb, combination treatment. Scale bars, 10μm. (E) Kaplan-Meier survival analysis for ALK F1174L/MYCN animals (10 per group) treated for 14 days with crizotinib and Torin2 as single or combined agents. Crizotinib vs. combination, p = 0.007; Torin2 vs. combination, p = 0.02; both comparisons by log-rank test. See also Figure S5 and Table S1.
Similar articles
- Molecular rationale for the use of PI3K/AKT/mTOR pathway inhibitors in combination with crizotinib in ALK-mutated neuroblastoma.
Moore NF, Azarova AM, Bhatnagar N, Ross KN, Drake LE, Frumm S, Liu QS, Christie AL, Sanda T, Chesler L, Kung AL, Gray NS, Stegmaier K, George RE. Moore NF, et al. Oncotarget. 2014 Sep 30;5(18):8737-49. doi: 10.18632/oncotarget.2372. Oncotarget. 2014. PMID: 25228590 Free PMC article. - Proliferation and Survival of Embryonic Sympathetic Neuroblasts by MYCN and Activated ALK Signaling.
Kramer M, Ribeiro D, Arsenian-Henriksson M, Deller T, Rohrer H. Kramer M, et al. J Neurosci. 2016 Oct 5;36(40):10425-10439. doi: 10.1523/JNEUROSCI.0183-16.2016. J Neurosci. 2016. PMID: 27707976 Free PMC article. - Intrinsic susceptibility MRI identifies tumors with ALKF1174L mutation in genetically-engineered murine models of high-risk neuroblastoma.
Jamin Y, Glass L, Hallsworth A, George R, Koh DM, Pearson AD, Chesler L, Robinson SP. Jamin Y, et al. PLoS One. 2014 Mar 25;9(3):e92886. doi: 10.1371/journal.pone.0092886. eCollection 2014. PLoS One. 2014. PMID: 24667968 Free PMC article. - Neuroblastoma models for insights into tumorigenesis and new therapies.
Kiyonari S, Kadomatsu K. Kiyonari S, et al. Expert Opin Drug Discov. 2015 Jan;10(1):53-62. doi: 10.1517/17460441.2015.974544. Epub 2014 Oct 25. Expert Opin Drug Discov. 2015. PMID: 25345447 Review. - Emerging importance of ALK in neuroblastoma.
Azarova AM, Gautam G, George RE. Azarova AM, et al. Semin Cancer Biol. 2011 Oct;21(4):267-75. doi: 10.1016/j.semcancer.2011.09.005. Epub 2011 Sep 16. Semin Cancer Biol. 2011. PMID: 21945349 Free PMC article. Review.
Cited by
- Lysophosphatidic Acid Stimulates Mitogenic Activity and Signaling in Human Neuroblastoma Cells through a Crosstalk with Anaplastic Lymphoma Kinase.
Dedoni S, Olianas MC, Onali P. Dedoni S, et al. Biomolecules. 2024 May 28;14(6):631. doi: 10.3390/biom14060631. Biomolecules. 2024. PMID: 38927035 Free PMC article. - N-MYC impairs innate immune signaling in high-grade serous ovarian carcinoma.
Miranda A, Pattnaik S, Hamilton PT, Fuss MA, Kalaria S, Laumont CM, Smazynski J, Mesa M, Banville A, Jiang X, Jenkins R, Cañadas I, Nelson BH. Miranda A, et al. Sci Adv. 2024 May 17;10(20):eadj5428. doi: 10.1126/sciadv.adj5428. Epub 2024 May 15. Sci Adv. 2024. PMID: 38748789 Free PMC article. - A human neural crest model reveals the developmental impact of neuroblastoma-associated chromosomal aberrations.
Saldana-Guerrero IM, Montano-Gutierrez LF, Boswell K, Hafemeister C, Poon E, Shaw LE, Stavish D, Lea RA, Wernig-Zorc S, Bozsaky E, Fetahu IS, Zoescher P, Pötschger U, Bernkopf M, Wenninger-Weinzierl A, Sturtzel C, Souilhol C, Tarelli S, Shoeb MR, Bozatzi P, Rados M, Guarini M, Buri MC, Weninger W, Putz EM, Huang M, Ladenstein R, Andrews PW, Barbaric I, Cresswell GD, Bryant HE, Distel M, Chesler L, Taschner-Mandl S, Farlik M, Tsakiridis A, Halbritter F. Saldana-Guerrero IM, et al. Nat Commun. 2024 May 3;15(1):3745. doi: 10.1038/s41467-024-47945-7. Nat Commun. 2024. PMID: 38702304 Free PMC article. - Histone lysine demethylase 4 family proteins maintain the transcriptional program and adrenergic cellular state of MYCN-amplified neuroblastoma.
Abu-Zaid A, Fang J, Jin H, Singh S, Pichavaram P, Wu Q, Tillman H, Janke L, Rosikiewicz W, Xu B, Van De Velde LA, Guo Y, Li Y, Shendy NAM, Delahunty IM, Rankovic Z, Chen T, Chen X, Freeman KW, Hatley ME, Durbin AD, Murray PJ, Murphy AJ, Thomas PG, Davidoff AM, Yang J. Abu-Zaid A, et al. Cell Rep Med. 2024 Mar 19;5(3):101468. doi: 10.1016/j.xcrm.2024.101468. Cell Rep Med. 2024. PMID: 38508144 Free PMC article. - CKLF instigates a "cold" microenvironment to promote MYCN-mediated tumor aggressiveness.
Qin X, Lam A, Zhang X, Sengupta S, Iorgulescu JB, Ni H, Das S, Rager M, Zhou Z, Zuo T, Meara GK, Floru AE, Kemet C, Veerapaneni D, Kashy D, Lin L, Lloyd K, Kwok L, Smith KS, Nagaraju RT, Meijers R, Ceol C, Liu CT, Alexandrescu S, Wu CJ, Keskin DB, George RE, Feng H. Qin X, et al. Sci Adv. 2024 Mar 15;10(11):eadh9547. doi: 10.1126/sciadv.adh9547. Epub 2024 Mar 15. Sci Adv. 2024. PMID: 38489372 Free PMC article.
References
- Arvanitis C, Felsher DW. Conditional transgenic models define how MYC initiates and maintains tumorigenesis. Semin Cancer Biol. 2006;16:313–317. - PubMed
- Brodeur G, Seeger RC, Schwab M, Varmus HE, Bishop JM. Amplification of N-myc in untreated human neuroblastomas correlates with advanced disease stage. Science. 1984;224:1121–1124. - PubMed
Publication types
MeSH terms
Substances
Grants and funding
- A10294/CRUK_/Cancer Research UK/United Kingdom
- CA136851-01A1/CA/NCI NIH HHS/United States
- 091763Z/10/Z/WT_/Wellcome Trust/United Kingdom
- C1060/A10334/CRUK_/Cancer Research UK/United Kingdom
- 11566/CRUK_/Cancer Research UK/United Kingdom
- R01 CA148688/CA/NCI NIH HHS/United States
- G1000121/1/NC3RS_/National Centre for the Replacement, Refinement and Reduction of Animals in Research/United Kingdom
- R01 CA136851/CA/NCI NIH HHS/United States
- C309/A8274/CRUK_/Cancer Research UK/United Kingdom
- C309/A11566/CRUK_/Cancer Research UK/United Kingdom
- A14610/CRUK_/Cancer Research UK/United Kingdom
- DH_/Department of Health/United Kingdom
- NC3R-G1000121/94513/MRC_/Medical Research Council/United Kingdom
- WT_/Wellcome Trust/United Kingdom
LinkOut - more resources
Full Text Sources
Other Literature Sources
Medical
Molecular Biology Databases
Miscellaneous

