The macrosatellite DXZ4 mediates CTCF-dependent long-range intrachromosomal interactions on the human inactive X chromosome - PubMed (original) (raw)
. 2012 Oct 15;21(20):4367-77.
doi: 10.1093/hmg/dds270. Epub 2012 Jul 12.
Affiliations
- PMID: 22791747
- PMCID: PMC3459461
- DOI: 10.1093/hmg/dds270
The macrosatellite DXZ4 mediates CTCF-dependent long-range intrachromosomal interactions on the human inactive X chromosome
Andrea H Horakova et al. Hum Mol Genet. 2012.
Abstract
The human X-linked macrosatellite DXZ4 is a large tandem repeat located at Xq23 that is packaged into heterochromatin on the male X chromosome and female active X chromosome and, in response to X chromosome, inactivation is organized into euchromatin bound by the insulator protein CCCTC-binding factor (CTCF) on the inactive X chromosome (Xi). The purpose served by this unusual epigenetic regulation is unclear, but suggests a Xi-specific gain of function for DXZ4. Other less extensive bands of euchromatin can be observed on the Xi, but the identity of the underlying DNA sequences is unknown. Here, we report the identification of two novel human X-linked tandem repeats, located 58 Mb proximal and 16 Mb distal to the macrosatellite DXZ4. Both tandem repeats are entirely contained within the transcriptional unit of novel spliced transcripts. Like DXZ4, the tandem repeats are packaged into Xi-specific CTCF-bound euchromatin. These sequences undergo frequent CTCF-dependent interactions with DXZ4 on the Xi, implicating DXZ4 as an epigenetically regulated Xi-specific structural element and providing the first putative functional attribute of a macrosatellite in the human genome.
Figures
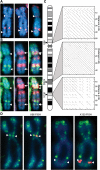
Figure 1.
Mapping of two novel tandem repeats at X56 and X130 to H3K4me2 bands on the inactive X chromosome (Xi). (A) Metaphase Xi showing H3K4me2 (red) merged with DAPI (blue). Signals at X56/X130 indicated by white arrowheads. (B) As above showing H3K4me2 (green) and macroH2A1 (red). White arrows indicate X56/130 proximal macroH2A1 bands. (C) Relative chromosomal location of X56/DXZ4/X130 and pairwise alignments of the corresponding DNA sequences (X56 = 56 781 370–56 833 369; DXZ4 = 114 959 731–115 005 842; X130 = 130 859 561–130 929 560; Hg19 coordinates). Pairwise alignments generated using YASS (57) using default alignment settings. (D) Metaphase Xi H3K4me2 distribution (green) merged with X56/X130 DNA FISH (red). Images in (A) were captured using a Zeiss Axiovert 200M, whereas the images in (D) were captured using a DeltaVision pDV with deconvolution, accounting for the sharper signals.
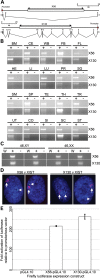
Figure 2.
Genomic organization and expression of X56 and X130. (A) Schematic maps showing the location of the tandem array (large white box indicated above by the X56 and X130 double-headed arrow) and transcriptional units at each location. The location of the promoter is indicated by the labelled red box and exon structure for the X56 (3 exons) and X130 (13 exons) transcripts are indicated directly beneath each map. The scale is given above each schematic and regions represented are X chromosome coordinates 56 755 370–56 845 001 bp for X56 and 130 835 825–130 965 880 bp for X130 based on Hg19. (B) Expression of X56 (671 bp product, PCR between exons 1 and 3) and X130 (301 bp product, PCR between exons 1 and 3) in cDNA prepared from total RNA extracted from a broad range of human tissues. Samples include cDNA template prepared with reverse transcriptase (+) and without (−). Tissues are: BM, bone marrow; CE, cerebellum; WB, whole brain; FB, fetal brain; FL, fetal liver; HE, heart; LI, liver; LU, lung; PR, prostate; SG, salivary gland; SM, skeletal muscle; SP, spleen; TE, testis; TH, thymus; TR, trachea; UT, uterus; CO, colon; SI, small intestine; SC, spinal cord; ST, stomach. (C) Expression of X56 and X130 in male (1139 and 1140) and female (hTERT-RPE1 and IMR90) cDNA. Samples as above, also showing a no-template water control (W). (D) RNA FISH analysis of X56 and X130 expression (green signals indicated by white arrow heads) relative to XIST RNA (red signal indicated by white arrow) in hTERT-RPE1 cells merged with DAPI (Blue). Images represent deconvolved sections. (E) Bar-chart indicating luciferase activity in 293 cell extracts 72h after transfection with the promoterless luciferase vector (pGL4.10) or the same vector containing an 852 bp fragment from the putative X56 promoter or 760 bp fragment from the putative X130 promoter. Fold activation of luciferase activity is shown to the left relative to the promoterless vector. Data represent replicated experiments each performed in triplicate.
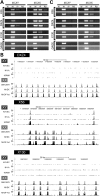
Figure 3.
Chromatin characterization of the X56 and X130 intervals. (A) H3K4me2 ChIP assessed by PCR to X56, DXZ4 and X130 for two independent males and females. W, water; IN, input; IP, anti-H3K4me2/CTCF; RS, rabbit serum. Beneath these three are ChIP PCR for the GAGE locus as a negative control for H3K4me2 and CTCF. The sequence of oligonucleotides used for PCR is listed in
Supplementary Material, Table S1
. (B) CTCF ChIP Seq profiles covering intervals of DXZ4, X56 and X130 for three independent male and three independent female samples. Images were extracted from the UCSC Genome Browser (
) that display data from the Encode histone modifications by Broad Institute ChIP Seq (36). Regions displayed correspond to DXZ4 (114 959 731–115 005 842), X56 (56 781 370–56 833 369) and X130 (130 859 561–130 929 560). Coordinates are based on human genome build Hg19. The peaks shown represent signal enrichment calculated from the density of sequence tags overlapping a 25 bp window. For each region (DXZ4, X56, and X130), the males (XY) are shown at the top, followed by the females (XX). Scale and chromosome coordinates are given above each profile. (C) CTCF ChIP assessed by PCR as for part (A).
Figure 4.
Interactions between DXZ4-X56 and DXZ4-X130. (A) FISH analysis of DXZ4 (green) and X56 or X130 (red) in male (46,XY) or female (46,XX) nuclei counterstained with DAPI. Signals are indicated by white arrowheads. The percentage of nuclei with FISH signals comparable with the examples given are indicated graphically to the right of the image. Independent male (1–7) and female (1–8) cell lines and number of nuclei scored are indicated in
Supplementary Material, Table S2
. (B) Two representative examples of H3K4me2 (blue) combined with DNA FISH to X130 (green) and X56 (red). Beneath each example is a blow-up of the Xi territory.
Figure 5.
Interaction frequencies between DXZ4-X56 and DXZ4-X130. Chromosome conformation capture analysis for (A) X56 v DXZ4 and (B) X130 v DXZ4. Above each image is an ideogram of the X chromosome showing the location of the two regions being tested for interaction by 3C. Beneath the ideogram is a graph showing a significant difference in the percentage of interaction relative to BAC controls between DXZ4 and two different regions of X56 (CF and DR) and X130 (CF and ER) in two independent male (left side) and female (right side) samples (P = 0.0335 X56-CF; P = 0.0048 X56-DR; P = <0.0001 X130-CF and X130-ER. _P_-values calculated using the two-sample _t_-test). Oligonucleotides used for PCR are listed in
Supplementary Material, Table S1
. Detailed restriction maps for the regions tested are shown in
Supplementary Material, Figure S1
.
Figure 6.
Intrachromosomal interactions are dependent on CTCF. (A) CTCF and b-actin western-blot analysis of whole-cell extracts from mock, untreated and CTCF siRNA-treated hTERT-RPE1 cells. (B) Change in the percentage of overlapping DXZ4 and X130 FISH signals in hTERT-RPE1cells treated with CTCF siRNA or an with unrelated siRNA relative to mock-treated cells. Data represent two independent experiments scoring 53 + 67 mock-treated nuclei, 56 + 61 CTCF-treated nuclei and 67 + 54 nuclei treated with unrelated siRNA. _P_-value calculated using the two samples _t_-test.
Figure 7.
Model to explain the structural role of Xi-specific CTCF bound DXZ4, X56 and X130. Far top left image is a female nucleus showing the distribution of H3K4me2 (green) and the hole with a ‘dot’ at the Xi (white arrow head). Bottom left image is a close up example of the Xi-hole with a ‘dot’ in female cells showing the distribution of H3K4me2 (blue) combined with DNA FISH signals for X56 (red) and X130 (green). Far top right image shows the nuclear distribution of mH2A1 (green) merged with HP1g (red) in a female nucleus with the location of the Xi indicated by the white arrow-head. A close up example of HP1g (red) and mH2A1 (red) at the Xi is shown at the bottom in the middle. Directly above this is a schematic representation of chromatin at and flanking DXZ4, X56 and X130 showing HP1, mH2A1 or CTCF bound chromatin (red, green and blue squiggly lines, respectively).
Similar articles
- Characterization of DXZ4 conservation in primates implies important functional roles for CTCF binding, array expression and tandem repeat organization on the X chromosome.
McLaughlin CR, Chadwick BP. McLaughlin CR, et al. Genome Biol. 2011;12(4):R37. doi: 10.1186/gb-2011-12-4-r37. Epub 2011 Apr 13. Genome Biol. 2011. PMID: 21489251 Free PMC article. - YY1 associates with the macrosatellite DXZ4 on the inactive X chromosome and binds with CTCF to a hypomethylated form in some male carcinomas.
Moseley SC, Rizkallah R, Tremblay DC, Anderson BR, Hurt MM, Chadwick BP. Moseley SC, et al. Nucleic Acids Res. 2012 Feb;40(4):1596-608. doi: 10.1093/nar/gkr964. Epub 2011 Nov 7. Nucleic Acids Res. 2012. PMID: 22064860 Free PMC article. - Grabbing the genome by the NADs.
Matheson TD, Kaufman PD. Matheson TD, et al. Chromosoma. 2016 Jun;125(3):361-71. doi: 10.1007/s00412-015-0527-8. Epub 2015 Jul 15. Chromosoma. 2016. PMID: 26174338 Free PMC article. Review. - Macrosatellite epigenetics: the two faces of DXZ4 and D4Z4.
Chadwick BP. Chadwick BP. Chromosoma. 2009 Dec;118(6):675-81. doi: 10.1007/s00412-009-0233-5. Epub 2009 Aug 19. Chromosoma. 2009. PMID: 19690880 Review.
Cited by
- Plastin 3 in health and disease: a matter of balance.
Wolff L, Strathmann EA, Müller I, Mählich D, Veltman C, Niehoff A, Wirth B. Wolff L, et al. Cell Mol Life Sci. 2021 Jul;78(13):5275-5301. doi: 10.1007/s00018-021-03843-5. Epub 2021 May 23. Cell Mol Life Sci. 2021. PMID: 34023917 Free PMC article. Review. - XIST directly regulates X-linked and autosomal genes in naive human pluripotent cells.
Dror I, Chitiashvili T, Tan SYX, Cano CT, Sahakyan A, Markaki Y, Chronis C, Collier AJ, Deng W, Liang G, Sun Y, Afasizheva A, Miller J, Xiao W, Black DL, Ding F, Plath K. Dror I, et al. Cell. 2024 Jan 4;187(1):110-129.e31. doi: 10.1016/j.cell.2023.11.033. Cell. 2024. PMID: 38181737 Free PMC article. - Orientation-dependent Dxz4 contacts shape the 3D structure of the inactive X chromosome.
Bonora G, Deng X, Fang H, Ramani V, Qiu R, Berletch JB, Filippova GN, Duan Z, Shendure J, Noble WS, Disteche CM. Bonora G, et al. Nat Commun. 2018 Apr 13;9(1):1445. doi: 10.1038/s41467-018-03694-y. Nat Commun. 2018. PMID: 29654302 Free PMC article. - Trans- and cis-acting effects of Firre on epigenetic features of the inactive X chromosome.
Fang H, Bonora G, Lewandowski JP, Thakur J, Filippova GN, Henikoff S, Shendure J, Duan Z, Rinn JL, Deng X, Noble WS, Disteche CM. Fang H, et al. Nat Commun. 2020 Nov 27;11(1):6053. doi: 10.1038/s41467-020-19879-3. Nat Commun. 2020. PMID: 33247132 Free PMC article. - The mouse DXZ4 homolog retains Ctcf binding and proximity to Pls3 despite substantial organizational differences compared to the primate macrosatellite.
Horakova AH, Calabrese JM, McLaughlin CR, Tremblay DC, Magnuson T, Chadwick BP. Horakova AH, et al. Genome Biol. 2012 Aug 20;13(8):R70. doi: 10.1186/gb-2012-13-8-r70. Genome Biol. 2012. PMID: 22906166 Free PMC article.
References
- Lander E.S., Linton L.M., Birren B., Nusbaum C., Zody M.C., Baldwin J., Devon K., Dewar K., Doyle M., FitzHugh W., et al. Initial sequencing and analysis of the human genome. Nature. 2001;409: 860–921. - PubMed
- Ellegren H. Microsatellites: simple sequences with complex evolution. Nat. Rev. Genet. 2004;5:435–445. - PubMed
- Hannan A.J. Tandem repeat polymorphisms: modulators of disease susceptibility and candidates for ‘missing heritability. Trends Genet. 2010;26:59–65. - PubMed
Publication types
MeSH terms
Substances
LinkOut - more resources
Full Text Sources
Other Literature Sources
Miscellaneous


