SK2 channel modulation contributes to compartment-specific dendritic plasticity in cerebellar Purkinje cells - PubMed (original) (raw)
SK2 channel modulation contributes to compartment-specific dendritic plasticity in cerebellar Purkinje cells
Gen Ohtsuki et al. Neuron. 2012.
Abstract
Small-conductance Ca(2+)-activated K(+) channels (SK channels) modulate excitability and curtail excitatory postsynaptic potentials (EPSPs) in neuronal dendrites. Here, we demonstrate long-lasting plasticity of intrinsic excitability (IE) in dendrites that results from changes in the gain of this regulatory mechanism. Using dendritic patch-clamp recordings from rat cerebellar Purkinje cells, we find that somatic depolarization or parallel fiber (PF) burst stimulation induce long-term amplification of synaptic responses to climbing fiber (CF) or PF stimulation and enhance the amplitude of passively propagated sodium spikes. Dendritic plasticity is mimicked and occluded by the SK channel blocker apamin and is absent in Purkinje cells from SK2 null mice. Triple-patch recordings from two dendritic sites and the soma and confocal calcium imaging studies show that local stimulation limits dendritic plasticity to the activated compartment of the dendrite. This plasticity mechanism allows Purkinje cells to adjust the SK2-mediated control of dendritic excitability in an activity-dependent manner.
Copyright © 2012 Elsevier Inc. All rights reserved.
Figures
Figure 1
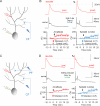
Depolarization-evoked Na+ spikes and CF responses in somato-dendritic double-patch recordings. (A) Recording configuration. Patch-clamp recordings were obtained from the soma and the dendrite of Purkinje cells. Depolarizing current pulses were applied through the somatic patch electrode. The CF input was activated using extracellular stimulation with a glass pipette filled with ACSF. (B) DIC image illustrating the double-patch configuration. Arrows outline the course of the primary dendrite. Glass pipettes for PF and CF stimulation, respectively, are shown in the upper left and right corners. (C) Examples of Na+ spikes evoked by somatic depolarization (left) and CF responses (right) recorded at dendritic locations (red traces) and the soma (black traces). (D) Distance dependence of Na+ spike (blue) and CF response (orange) amplitudes. The fitted lines were obtained using the least-square method.
Figure 2
Dendritic patch-clamp recordings reveal activity-dependent changes in dendritic responsiveness. (A) Recording configuration for the experiments shown in (B). Responses to CF activation were recorded before and after repeated injection of depolarizing currents into the soma. (B) The somatic depolarization protocol enhances CF responses (arrow). Lower left: Time graph showing changes in the amplitude of dendritically recorded CF responses after tetanization (closed dots; n=7) and under control conditions (open dots; n=6). Lower right: Time graph showing associated changes in the number of spikelets in the complex spike after tetanization (closed dots; n=7) and under control conditions (open dots; n=6). (C) Recording configuration for the experiments shown in (D). Responses to CF activation were recorded before and after 50Hz PF tetanization. (D) 50Hz PF burst stimulation causes an increase in dendritic CF response amplitudes (lower left) and the spikelet number (lower right; n=5). Arrows indicate tetanization. Error bars indicate SEM.
Figure 3
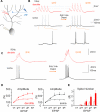
Repeated somatic injection of depolarizing currents enhances the frequency and dendritic amplitude of Na+ spikes. (A) Recording configuration. Na+ spikes evoked by single depolarizing current pulses injected into the soma were recorded in the test periods before and after repeated somatic current injection at 5Hz. (B) The depolarization protocol enhances the number of action potentials and the amplitude of dendritic Na+ spikes (red traces; enlarged in the insets). Lower left: Time graph showing Na+ spike amplitude changes recorded in the dendrite after tetanization (closed dots; n=10) and under control conditions (open dots; n=5). Lower right: Time graph showing associated changes in the spike count after tetanization (closed dots; n=10) and under control conditions (open dots; n=5). Arrows indicate tetanization. Error bars indicate SEM.
Figure 4
Dendritic plasticity is mediated by SK2 channel downregulation. (A) Bath-application of the SK channel blocker apamin (10nM) enhances CF responses. Lower left: Time graph showing changes in dendritic CF response amplitudes (red dots). Lower right: Time graph showing changes in the spikelet number (blue dots; n=6). (B) In the presence of apamin in the bath, dendritic plasticity (depolarization protocol) is occluded. Lower left: Time graph showing dendritic CF responses (red dots) when apamin was present in the bath. Lower right: Time graph showing spikelet number changes (blue dots; n=6). (C) Apamin application enhances the spike count and the dendritic Na+ spike amplitude (red traces; enlarged in the insets). Lower left: Time graph showing changes in the Na+ spike amplitude (n=9). Lower right: Time graph showing spike count changes (n=9). Bars indicate the presence of apamin in the bath. (D) Dendritic plasticity is absent in SK2−/− mice, but can be elicited in WT littermates. Top: Typical traces obtained before (left) and after tetanization (right) from WT (top row) and SK2−/− Purkinje cells (bottom row). Bottom: Time graph showing changes in dendritic CF response amplitudes in SK2−/− mice (blue dots; n=4; n=5 up to t=4min) and WT mice (green dots; n=6). The recording configuration for panels (A), (B) and (D) corresponds to the configuration shown in Fig. 2A. The recording configuration for panel (C) corresponds to the configuration shown in Fig. 3A. Arrows indicate tetanization. Error bars indicate SEM.
Figure 5
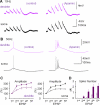
Dendritic plasticity enhances parallel fiber burst signaling. (A) Recording configuration. PF responses were measured before and after application of the somatic depolarization protocol. (B) Repeated somatic depolarization does not alter the first EPSP in a 10Hz EPSP train, but enhances amplification of subsequent EPSPs. Left traces: dendritic (red) and somatic (black) baseline responses. Right traces: 20min after tetanization. (C) Tetanization enhances the facilitation within 50Hz EPSP trains. (D) EPSP facilitation within 10Hz trains before (open dots) and after tetanization (closed dots) in the dendrite (left) and soma (right; n=9). In the presence of spikes, the EPSP amplitude was measured as the amplitude of the slow response component. EPSP amplitudes were normalized to the amplitude of EPSP 1 in the same train. (E) The probability of spike firing was enhanced for the late EPSPs within a 50Hz EPSP train (n=8). The PF-EPSP train measures were obtained during the experiments shown in Figs. 2B and 3. Three to nine sweeps were collected at minutes −10 to −7 (baseline), three sweeps were collected at minute −1 (before tetanization), and nine sweeps or more were collected at minutes +20 to 30 (after tetanization). Error bars indicate SEM.
Figure 6
Apamin bath-application enhances parallel fiber burst signaling. (A) When apamin was bath-applied, the EPSP amplification within a 10Hz EPSP train was enhanced (n=10) as compared to control (n=7). The recording configuration corresponds to the configuration shown in Fig. 5A, but in the experiments shown here no tetanization protocol was applied. The traces shown on the right were recorded 20min after wash-in of apamin. (B) In the presence of apamin in the bath, EPSP facilitation was observed in 50Hz EPSP trains. (C) EPSP facilitation under control conditions (open dots; n=7) and in the presence of apamin (10nM; closed dots; n=10) in the dendrite (left; purple dots) and the soma (right; black dots). (D) The facilitation within 50Hz trains resulted in an enhanced spike number in the late EPSPs (control: n=7; apamin: n=10). Error bars indicate SEM.
Figure 7
Triple-patch recordings reveal location-specific dendritic plasticity. (A) Recording configuration. CF responses were recorded in two dendritic locations and the soma before and after either weak PF activation or repeated current injection at one of the dendritic recording sites. (B) DIC image showing how simultaneous recordings are obtained from two different branches (blue and red patch pipettes), and the soma (white). (C) DIC image showing the second configuration, in which recordings were obtained from two sites on the same branch. In (B) and (C), arrows indicate the course of the primary dendrite. (D) Responses to somatic depolarization (left) and CF stimulation (right). These recordings were obtained at two sites on the same branch (70 and 125μm). (E) Example of responses to weak 50Hz PF activation at the conditioned (red trace) and the unconditioned site (blue trace). For comparison, the grey trace on top shows a typical response resulting from strong 50Hz PF activation as used for global excitability changes. (F) Example responses to current injection (+80pA) at one recording site (red trace), but not the other (blue trace). (G) Bar graphs showing response amplitudes monitored at the conditioned and the unconditioned dendritic recording site (n=5). (H) The increase in CF response amplitudes was restricted to the locally conditioned (here: PF tetanization protocol) recording site (red traces), while CF responses recorded at the unconditioned site (blue traces) remained unchanged. (I) Time graph showing changes in CF response amplitudes at the conditioned dendritic site (red dots), the unconditioned site (blue dots) and the soma (black dots; n=5). On the right, the amplitude changes are separately shown for the two stimulus protocols (average: last 5 min; 50Hz PF bursts: closed squares; n=3; depolarization: open squares; n=2). The arrow indicates tetanization. Error bars indicate SEM.
Figure 8
Confocal calcium imaging shows location-specific dendritic plasticity. (A) Top: Purkinje cell filled with Alexa 633. The lines indicate the location of the somatic patch electrode as well as the glass pipettes that were used for PF (left) and CF stimulation (right). Scale bar: 50μm. Middle: Enlarged view of the area indicated by the white box in the top picture. Left: Red fluorescence of Alexa 633 (30μM). Right: Green fluorescence of Oregon Green BAPTA-2 (200μM). Scale bars: 10μm. Bottom: Image illustrating the location of the stimulus pipette (red dot), and of ROIs 1–3. The red line indicates the dendritic axis along which the distance of ROI-2 and -3 (center of the ROI box) from ROI-1 was determined. Scale bar: 10μm. (B) Complex spikes recorded during the baseline (left) and after tetanization (middle). Right: Overlay of the traces. (C) Weak PF activation did not change the number of spikelets in the complex spike waveform (n=9). (D) CF-evoked calcium transients at ROI-1 (top), ROI-2 (middle) and ROI-3 (bottom) before (left) and after tetanization (middle). Right: Overlay of the traces. (E) Top: Calcium transients monitored during the PF tetanization protocol (first two seconds) at ROIs 1–3. Bottom: Somatic response to PF tetanization. Stimulus artifacts and antidromic spikes were suppressed. (F) Bar graphs indicate calcium transients evoked during PF tetanization at ROI-1 (≤ 10μm distance from stimulus pipette), ROI 2 (10–30μm distance from ROI-1) and ROI-3 (30–60μm distance from ROI-1). Calcium transients were recorded during tetanization in 3/9 cells. (G) Time graph showing changes in the peak amplitude of CF-evoked calcium transients after PF tetanization at ROI-1 and at ROIs located at a distance of 30–60μm from ROI-1 (n=9). (H) Time graph showing corresponding changes in the area under the curve of CF-evoked calcium transients (n=9). (I) Left: Bar graphs summarizing peak amplitude changes at ROI-1 as well as ROIs located at 10–30μm and 30–60μm distance from ROI-1, respectively (n=9). Right: Corresponding changes in the area under the curve (n=9). Error bars indicate SEM. Asterisks indicate significant difference from baseline (paired Student's t-test). * p<0.05 and ** p<0.01.
Similar articles
- Modification of Synaptic-Input Clustering by Intrinsic Excitability Plasticity on Cerebellar Purkinje Cell Dendrites.
Ohtsuki G. Ohtsuki G. J Neurosci. 2020 Jan 8;40(2):267-282. doi: 10.1523/JNEUROSCI.3211-18.2019. Epub 2019 Nov 21. J Neurosci. 2020. PMID: 31754008 Free PMC article. - Activity-Dependent Plasticity of Spike Pauses in Cerebellar Purkinje Cells.
Grasselli G, He Q, Wan V, Adelman JP, Ohtsuki G, Hansel C. Grasselli G, et al. Cell Rep. 2016 Mar 22;14(11):2546-53. doi: 10.1016/j.celrep.2016.02.054. Epub 2016 Mar 10. Cell Rep. 2016. PMID: 26972012 Free PMC article. - The Origin of Physiological Local mGluR1 Supralinear Ca2+ Signals in Cerebellar Purkinje Neurons.
Ait Ouares K, Canepari M. Ait Ouares K, et al. J Neurosci. 2020 Feb 26;40(9):1795-1809. doi: 10.1523/JNEUROSCI.2406-19.2020. Epub 2020 Jan 22. J Neurosci. 2020. PMID: 31969470 Free PMC article. - SK2 channel expression and function in cerebellar Purkinje cells.
Hosy E, Piochon C, Teuling E, Rinaldo L, Hansel C. Hosy E, et al. J Physiol. 2011 Jul 15;589(Pt 14):3433-40. doi: 10.1113/jphysiol.2011.205823. Epub 2011 Apr 26. J Physiol. 2011. PMID: 21521760 Free PMC article. Review. - Dendritic calcium signaling in cerebellar Purkinje cell.
Kitamura K, Kano M. Kitamura K, et al. Neural Netw. 2013 Nov;47:11-7. doi: 10.1016/j.neunet.2012.08.001. Epub 2012 Sep 5. Neural Netw. 2013. PMID: 22985934 Review.
Cited by
- Plasma membrane SK2 channel activity regulates migration and chemosensitivity of high-grade serous ovarian cancer cells.
Romito O, Lemettre A, Chantôme A, Champion O, Couty N, Ouldamer L, Hempel N, Trebak M, Goupille C, Potier-Cartereau M. Romito O, et al. Mol Oncol. 2024 Aug;18(8):1853-1865. doi: 10.1002/1878-0261.13631. Epub 2024 Mar 13. Mol Oncol. 2024. PMID: 38480668 Free PMC article. - Muscarinic Modulation of SK2-Type K+ Channels Promotes Intrinsic Plasticity in L2/3 Pyramidal Neurons of the Mouse Primary Somatosensory Cortex.
Gill DF, Hansel C. Gill DF, et al. eNeuro. 2020 Mar 16;7(2):ENEURO.0453-19.2020. doi: 10.1523/ENEURO.0453-19.2020. Print 2020 Mar/Apr. eNeuro. 2020. PMID: 32005752 Free PMC article. - Systemic pharmacological suppression of neural activity reverses learning impairment in a mouse model of Fragile X syndrome.
Shakhawat AM, Foltz JG, Nance AB, Bhateja J, Raymond JL. Shakhawat AM, et al. bioRxiv [Preprint]. 2024 Apr 5:2023.10.05.561013. doi: 10.1101/2023.10.05.561013. bioRxiv. 2024. PMID: 37873217 Free PMC article. Updated. Preprint. - Potential therapeutic approaches for Angelman syndrome.
Bi X, Sun J, Ji AX, Baudry M. Bi X, et al. Expert Opin Ther Targets. 2016;20(5):601-13. doi: 10.1517/14728222.2016.1115837. Epub 2015 Nov 26. Expert Opin Ther Targets. 2016. PMID: 26558806 Free PMC article. Review. - Differential regulations of vestibulo-ocular reflex and optokinetic response by β- and α2-adrenergic receptors in the cerebellar flocculus.
Wakita R, Tanabe S, Tabei K, Funaki A, Inoshita T, Hirano T. Wakita R, et al. Sci Rep. 2017 Jun 21;7(1):3944. doi: 10.1038/s41598-017-04273-9. Sci Rep. 2017. PMID: 28638085 Free PMC article.
References
- Aizenman CD, Linden DJ. Regulation of the rebound depolarization and spontaneous firing patterns of deep nuclear neurons in slices of rat cerebellum. J. Neurophysiol. 1999;82:1697–1709. - PubMed
- Belmeguenai A, Hosy E, Bengtsson F, Pedroarena CM, Piochon C, Teuling E, He Q, Ohtsuki G, De Jeu MTG, Elgersma Y, De Zeeuw CI, Jörntell H, Hansel C. Intrinsic plasticity complements long-term potentiation in parallel fiber input gain control in cerebellar Purkinje cells. J. Neurosci. 2010;30:13630–13643. - PMC - PubMed
- Cai X, Liang CW, Muralidharan S, Kao JP, Tang CM, Thompson SM. Unique roles of SK and Kv4.2 potassium channels in dendritic integration. Neuron. 2004;44:351–364. - PubMed
Publication types
MeSH terms
Substances
Grants and funding
- R56 NS062771/NS/NINDS NIH HHS/United States
- R01 NS062771/NS/NINDS NIH HHS/United States
- NS-038880/NS/NINDS NIH HHS/United States
- R01 NS038880/NS/NINDS NIH HHS/United States
- NS-062771/NS/NINDS NIH HHS/United States
- R01 MH093599/MH/NIMH NIH HHS/United States
LinkOut - more resources
Full Text Sources
Molecular Biology Databases
Miscellaneous


