Cell-cycle-coupled structural oscillation of centromeric nucleosomes in yeast - PubMed (original) (raw)
Cell-cycle-coupled structural oscillation of centromeric nucleosomes in yeast
Manjunatha Shivaraju et al. Cell. 2012.
Abstract
The centromere is a specialized chromosomal structure that regulates chromosome segregation. Centromeres are marked by a histone H3 variant. In budding yeast, the histone H3 variant Cse4 is present in a single centromeric nucleosome. Experimental evidence supports several different models for the structure of centromeric nucleosomes. To investigate Cse4 copy number in live yeast, we developed a method coupling fluorescence correlation spectroscopy and calibrated imaging. We find that centromeric nucleosomes have one copy of Cse4 during most of the cell cycle, whereas two copies are detected at anaphase. The proposal of an anaphase-coupled structural change is supported by Cse4-Cse4 interactions, incorporation of Cse4, and the absence of Scm3 in anaphase. Nucleosome reconstitution and ChIP suggests both Cse4 structures contain H2A/H2B. The increase in Cse4 intensity and deposition at anaphase are also observed in Candida albicans. Our experimental evidence supports a cell-cycle-coupled oscillation of centromeric nucleosome structure in yeast.
Copyright © 2012 Elsevier Inc. All rights reserved.
Figures
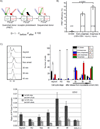
Figure 1. Cse4-EGFP intensity doubles at anaphase B
A) Time-lapse series of a centromere cluster followed from G1 to telophase indicates that Cse4 intensity doubles in anaphase. Quantification of centromere localized Cse4-EGFP-fluorescence shows that at anaphase the intensity doubled compared to G1 and telophase (n=14). B) The spindle pole body (SPB) was used as a cell cycle stage marker and the distances were measured between SPBs and centromere clusters in 3D using Image J. C) Anaphase centromeric clusters are brighter than clusters in G1/telophase cells. The left panel shows a heat map for centromeric Cse4-EGFP brightness in different stages of cells. The numbers in the image indicate cell cycle phase based on bud morphology: 1) G1, 2) telophase/G1, 3) M, 4) early S phase, 5) M and 6) late anaphase. Centromeric clusters in M and late anaphase are brighter than those in G1 or telophase. See Supplemental Figure 1 and Movie S1.
Figure 2. Cse4-Cse4 interactions are restricted to anaphase
A) Simplified schematic of acceptor photobleaching. FRET can occur when a donor (e.g. Cse4-EGFP) and acceptor (e.g. Cse4-mCherry) are very close to each other (<10µm). If the acceptor is photobleached, emission from the donor will increase. B) FRET between Cse4-EGFP and Cse4-mCherry occurs only at anaphase. The FRET efficiency was measured in cycling cells (n=257). The cell cycle stage was defined by measuring the distance between centromere clusters (see Figure 1). FRET was not detected for G1, S or M phase cells. Following centromere cluster separation, FRET is observed. Error bars represent ± the standard deviation. C. Cse4-Cse4 interaction occurs only during anaphase. Sequential ChIP was performed on MNase-treated chromatin from strain MM118 using primers that amplify 125-bp of CEN3 sequence (Krassovsky et al., 2012). The signal from each XChIP has been divided by the signal obtained with total chromatin. The GAL2 gene serves as a negative control for Cse4 localization. Error bars represent ± the average deviation.
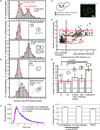
Figure 3. Experimental design to determine the number of Cse4-EGFP per centromere
A) A yeast strain expressing cytosolic EGFP was analyzed by fluorescence correlation spectroscopy (FCS) to determine the average number of EGFP molecules in a focal volume. The number of molecules in the focal volume in FCS is determined by γ/G0, where G0 is the amplitude of the correlation curve propagated to τ= 0. γ was determined to be 0.27, consistent with values published for FCS with 1-photon excitation. B) Calibrated images were acquired for cytosolic EGFP (A) and a yeast strain expressing Cse4-EGFP. C) To determine number of Cse4-EGFP per centromere, it was necessary to distinguish the emission emanating from the point centromere cluster from the background nuclear Cse4 signal. Therefore, we selected the z-slice where each centromere cluster was best in focus and fit the profile to a 2D Gaussian distribution, and selected the value of the peak minus the background as the intensity. D) γ from a point source is equal to 1; therefore we directly compared the intensity of the centromere cluster to the intensity we obtained for cytosolic EGFP using identical imaging parameters. With the known number of molecules of cytosolic EGFP from the FCS measurement, comparison allows for calculation of the number of Cse4-EGFP per centromere cluster. See Supplemental Figures 2 and 3.
Figure 4. Two copies of Cse4 per centromere at anaphase and one copy of Cse4 for G1/telophase
The stoichiometry of Cse4 per centromere cluster was measured in vivo, using FCS combined with calibrated imaging. A) A histogram is shown for Cse4-GFP/clusters in cycling cells (top panel) (n=420). Based on bud morphology and centromere cluster position, these cells were sorted into the G1 population (middle panel, n=87) and the mid to late anaphase population (bottom panel, n=187). B) Cells were arrested with either α factor in the top panel (G1), n=114, or nocodazole and released immediately prior to imaging in the bottom panel (early anaphase), n=80. Histograms are plotted for Cse4-EGFP/cluster in arrested cells. C) A schematic representation of how we measured distance between the SPBs to define the cell cycle stage is shown. The right side panel contains an image of live cells with centromere clusters (Cse4-EGFP) and SPBs (Spc42-mCherry). D) The number of Cse4 copies per cluster is plotted as a function of SPB distance. The three red boxes indicate populations of cells with the given SPB distances and the range of Cse4 copies per centromere clusters; i) 15–36, ii) 28–36 and iii) 15–26. E) The average number of Cse4 copies per cluster for A, B, and D. Error bars represent ± the standard deviation. P values are calculated by standard student’s t-test. F) The fluorescent lifetime measurements show similar lifetimes for EGFP and Cse4-EGFP and Cse4-EGFP in different stages of the cell cycle. The left panel shows the normalized average fluorescence decay for Cse4-EGFP centromere clusters in G1 to M (blue), mid-late anaphase (red), and unmodified EGFP from nuclear regions. The right panel shows the bar plot for fluorescent lifetimes from single exponential fits of Cse4-EGFP centromere clusters in G1 to M, mid to late anaphase, and regions in yeast nuclei expressing EGFP alone. Error bars represent ± the standard error of the mean. See Supplemental Figures 4, 5, and 6.
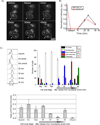
Figure 5. Timing of Cse4 deposition at early anaphase corresponds with absence of Scm3
A) Cells expressing Cse4-EGFP were photobleached (0 min) immediately following centromere cluster separation. The recovery of fluorescence was monitored at 15, 25, 30, and 40 mins. The white arrow indicates the cell being followed. B) The starting fluorescence (pre-bleach) intensity was normalized to 1 and the recovery is shown as a function of time. The average recovery from 14 sets was 37 +/− 4 %. See movie S2. C) Scm3 disappears from centromere during early to late anaphase. Quantitative PCR (qPCR) results of the Scm3-3HA XChIP for the 125-bp region of CEN3 (Krassovsky et al., 2012). Cells were double synchronized, first with hydroxyurea and second with nocodazole and after release time points were taken and cell cycle stage was scored by DAPI staining and cell morphology. Error bars represent ± the average deviation. GAL2 is a negative control for Scm3 localization. Without antibody, the XChIP/qPCR signal was <10% of the total signal; this has been subtracted from the values presented.
Figure 6. Fluorescence measurements of Cse4 relative to NPC components and Cse4 in C. albicans
A) The intensity of a Cse4 cluster and Nup49 in a single NPC were compared in a single image. A heat map was developed by maximum intensity projection of all z stacks. Cell cycle stages for Cse4-EGFP expressing cells were determined by bud morphology. Clusters of Cse4-EGFP had a comparable intensity to Nup49-EGFP in G1 (top panel). However, Cse4-EGFP clusters at anaphase showed twice the intensity of Nup49-EGFP (bottom panel). B) We used FCS in conjunction with calibrated imaging (Figure 3) to calculate the number of GFP copies per focus. The number of Nup159, Nup49, and Nic96 molecules in a single NPC is predicted to be 8, 16, and 32 respectively (Alber et al., 2007a; Alber et al., 2007b; Cronshaw et al., 2002; Rout et al., 2000; Wente and Rout, 2010). The average number of Nup159-EGFP, Nup49-EGFP, and Nic96-EGFP molecules in a single NPC was ~8 (n=17), ~16 (n=21), and ~32 (n=29) compared to ~16 copies/cluster of Cse4-EGFP at G1 (n=45) and ~32 copies/cluster in anaphase B (n=50). Error bars represent ± the standard deviation. P values are calculated by standard student’s t-test. C) The doubling of Cse4 intensity in anaphase is observed in Candida albicans. CaCse4-GFP intensity was analyzed specifically from early anaphase to late anaphase (anaphase B). A heat map (top panel) was developed by maximum intensity projection of all z slices of a z-stack (bottom panel). D) Quantification of CaCse4-GFP intensity. The intensity of CaCse4-GFP doubled at anaphase B. This is anexample (n=5) of fluorescent intensity from early anaphase to anaphase B. E) Cells expressing CaCse4-GFP were photobleached (bleach) immediately following centromere cluster separation. The recovery of fluorescence was monitored at 20 and 60 mins. F) The starting fluorescence (pre-bleach) intensity was normalized to 1 and the recovery is shown as a function of time. The average recovery from 4 sets was 42% +/− 3%. See Movie S3 and S4 and Supplemental Figure 7.
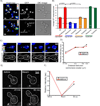
Figure 7. Biochemical properties of Scm3 assembled and Nap1 assembled Cse4 nucleosomes
Centromeric nucleosomes were assembled on a plasmid containing 10 copies of CEN1 or 5S positioning sequence (Shivaraju et al., 2011). A) Schematic representation of the mononucleosome purification is shown. Chromatin was reconstituted on the plasmid containing 10 copies of CEN1, MNase treated for 5 minutes, and the mixture was fractionated on a superdex-200 column using a Smart system. The mononucleosome fraction was recovered for further analysis. Protein content was analyzed by SDS-PAGE (B) for Nap1 Cse4 assembled mononucleosomes or western blotting (C) for Scm3 assembled Cse4 mononucleosomes. D) A molecular size standard was run on the same column used for fractionation, and an apparent MW standard curve was created. Error is estimated to be +/− 10 kDa. The MW of an assembled nucleosome is calculated to be ~530 kD for Nap1 assembled and ~320 kDa for Scm3 assembled nucleosomes. The calculated weight for an octamer and DNA is ~229 kDa. E) Chromatin assembly reactions were performed by incubating the relaxed CEN1 or 5S plasmid separately with the indicated proteins. Topoisomers are separated on an agarose gel without chloroquine (top panel) or with chloroquine (bottom panel). The Scm3 assembled nucleosomes do not exhibit the same shift in topoisomers observed in the Nap1 assembled nucleosomes. F) H2A-FLAG ChIP was conducted as in Figure 5C except that crosslinking was omitted and the chromatin was treated with MNase prior to immunoprecipitation. The results from a single timecourse are shown; the experiment was repeated twice with similar results. As a control we performed the ChIP on a strain without a FLAG tag on H2A (no tag).
Comment in
- Chromatin: nucleosomal dynamics at centromeres.
Burgess DJ. Burgess DJ. Nat Rev Genet. 2012 Sep;13(9):596-7. doi: 10.1038/nrg3313. Epub 2012 Aug 7. Nat Rev Genet. 2012. PMID: 22868266 No abstract available. - Chromatin: Nucleosomal dynamics at centromeres.
Burgess DJ. Burgess DJ. Nat Rev Mol Cell Biol. 2012 Sep;13(9):539. doi: 10.1038/nrm3423. Nat Rev Mol Cell Biol. 2012. PMID: 22914287 No abstract available.
Similar articles
- Cse4 is part of an octameric nucleosome in budding yeast.
Camahort R, Shivaraju M, Mattingly M, Li B, Nakanishi S, Zhu D, Shilatifard A, Workman JL, Gerton JL. Camahort R, et al. Mol Cell. 2009 Sep 24;35(6):794-805. doi: 10.1016/j.molcel.2009.07.022. Mol Cell. 2009. PMID: 19782029 Free PMC article. - Nonhistone Scm3 binds to AT-rich DNA to organize atypical centromeric nucleosome of budding yeast.
Xiao H, Mizuguchi G, Wisniewski J, Huang Y, Wei D, Wu C. Xiao H, et al. Mol Cell. 2011 Aug 5;43(3):369-80. doi: 10.1016/j.molcel.2011.07.009. Mol Cell. 2011. PMID: 21816344 Free PMC article. - Structure and Scm3-mediated assembly of budding yeast centromeric nucleosomes.
Dechassa ML, Wyns K, Li M, Hall MA, Wang MD, Luger K. Dechassa ML, et al. Nat Commun. 2011;2:313. doi: 10.1038/ncomms1320. Nat Commun. 2011. PMID: 21587230 Free PMC article. - Protein kinases in mitotic phosphorylation of budding yeast CENP-A.
Mishra PK, Basrai MA. Mishra PK, et al. Curr Genet. 2019 Dec;65(6):1325-1332. doi: 10.1007/s00294-019-00997-5. Epub 2019 May 22. Curr Genet. 2019. PMID: 31119371 Review. - The unconventional structure of centromeric nucleosomes.
Henikoff S, Furuyama T. Henikoff S, et al. Chromosoma. 2012 Aug;121(4):341-52. doi: 10.1007/s00412-012-0372-y. Epub 2012 May 3. Chromosoma. 2012. PMID: 22552438 Free PMC article. Review.
Cited by
- The split personality of CENP-A nucleosomes.
Westhorpe FG, Straight AF. Westhorpe FG, et al. Cell. 2012 Jul 20;150(2):245-7. doi: 10.1016/j.cell.2012.07.003. Cell. 2012. PMID: 22817887 Free PMC article. - The ATAD2/ANCCA homolog Yta7 cooperates with Scm3HJURP to deposit Cse4CENP-A at the centromere in yeast.
Shahnejat-Bushehri S, Ehrenhofer-Murray AE. Shahnejat-Bushehri S, et al. Proc Natl Acad Sci U S A. 2020 Mar 10;117(10):5386-5393. doi: 10.1073/pnas.1917814117. Epub 2020 Feb 20. Proc Natl Acad Sci U S A. 2020. PMID: 32079723 Free PMC article. - Dimerization of the CENP-A assembly factor HJURP is required for centromeric nucleosome deposition.
Zasadzińska E, Barnhart-Dailey MC, Kuich PH, Foltz DR. Zasadzińska E, et al. EMBO J. 2013 Jul 31;32(15):2113-24. doi: 10.1038/emboj.2013.142. Epub 2013 Jun 14. EMBO J. 2013. PMID: 23771058 Free PMC article. - Insights into Centromere DNA Bending Revealed by the Cryo-EM Structure of the Core Centromere Binding Factor 3 with Ndc10.
Zhang W, Lukoyanova N, Miah S, Lucas J, Vaughan CK. Zhang W, et al. Cell Rep. 2018 Jul 17;24(3):744-754. doi: 10.1016/j.celrep.2018.06.068. Cell Rep. 2018. PMID: 30021170 Free PMC article. - The stoichiometry of the outer kinetochore is modulated by microtubule-proximal regulatory factors.
Dhatchinamoorthy K, Unruh JR, Lange JJ, Levy M, Slaughter BD, Gerton JL. Dhatchinamoorthy K, et al. J Cell Biol. 2019 Jul 1;218(7):2124-2135. doi: 10.1083/jcb.201810070. Epub 2019 May 22. J Cell Biol. 2019. PMID: 31118239 Free PMC article.
References
- Alber F, Dokudovskaya S, Veenhoff LM, Zhang W, Kipper J, Devos D, Suprapto A, Karni-Schmidt O, Williams R, Chait BT, et al. Determining the architectures of macromolecular assemblies. Nature. 2007a;450:683–694. - PubMed
- Alber F, Dokudovskaya S, Veenhoff LM, Zhang W, Kipper J, Devos D, Suprapto A, Karni-Schmidt O, Williams R, Chait BT, et al. The molecular architecture of the nuclear pore complex. Nature. 2007b;450:695–701. - PubMed
- Antonin W, Ellenberg J, Dultz E. Nuclear pore complex assembly through the cell cycle: Regulation and membrane organization. FEBS Letters. 2008;582:2004–2016. - PubMed
- Bancaud A, Wagner G, Conde e Silva N, Lavelle C, Wong H, Mozziconacci J, Barbi M, Sivolob A, Le Cam E, Mouawad L, et al. Nucleosome Chiral Transition under Positive Torsional Stress in Single Chromatin Fibers. Molecular Cell. 2007;27:135–147. - PubMed
Publication types
MeSH terms
Substances
LinkOut - more resources
Full Text Sources
Other Literature Sources
Molecular Biology Databases


