HIV controllers maintain a population of highly efficient Th1 effector cells in contrast to patients treated in the long term - PubMed (original) (raw)
. 2012 Oct;86(19):10661-74.
doi: 10.1128/JVI.00056-12. Epub 2012 Jul 25.
Daniela Benati, Olivier Lambotte, Pierre de Truchis, Laurence Slama, Patricia Jeannin, Moran Galperin, Santiago Perez-Patrigeon, Faroudy Boufassa, William W Kwok, Fabrice Lemaître, Jean-François Delfraissy, Jacques Thèze, Lisa A Chakrabarti
Affiliations
- PMID: 22837194
- PMCID: PMC3457309
- DOI: 10.1128/JVI.00056-12
HIV controllers maintain a population of highly efficient Th1 effector cells in contrast to patients treated in the long term
Benoît Vingert et al. J Virol. 2012 Oct.
Abstract
HIV controllers are rare individuals who spontaneously control HIV replication in the absence of antiretroviral therapy. To identify parameters of the CD4 response that may contribute to viral control rather than merely reflect a persistently low viremia, we compared the T helper profiles in two groups of patients with more than 10 years of viral suppression: HIV controllers from the Agence Nationale de Recherche sur le SIDA et les Hépatites Virales (ANRS) CO18 cohort (n = 26) and efficiently treated patients (n = 16). Cells specific for immunodominant Gag and cytomegalovirus (CMV) peptides were evaluated for the production of 10 cytokines and cytotoxicity markers and were also directly quantified ex vivo by major histocompatibility complex (MHC) class II tetramer staining. HIV controller CD4(+) T cells were characterized by a higher frequency of gamma interferon (IFN-γ) production, perforin(+)/CD107a(+) expression, and polyfunctionality in response to Gag peptides. While interleukin 4 (IL-4), IL-17, and IL-21 production did not differ between groups, the cells of treated patients produced more IL-10 in response to Gag and CMV peptides, pointing to persistent negative immunoregulation after long-term antiretroviral therapy. Gag293 tetramer-positive cells were detected at a high frequency (0.12%) and correlated positively with IFN-γ-producing CD4(+) T cells in the controller group (R = 0.73; P = 0.003). Tetramer-positive cells were fewer in the highly active antiretroviral therapy (HAART) group (0.04%) and did not correlate with IFN-γ production, supporting the notion of a persistent immune dysfunction in HIV-specific CD4(+) T cells of treated patients. In conclusion, HIV controllers maintained a population of highly efficient Th1 effectors directed against Gag in spite of a persistently low antigenemia, while patients treated in the long term showed a loss of CD4 effector functions.
Figures
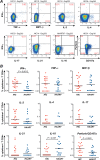
Fig 1
Intracellular cytokine production in patients' CD4+ T cells stimulated with Gag peptides. Intracellular cytokine staining (ICS) was done on PBMC stimulated overnight with the immunodominant peptides Gag161, Gag263, and Gag293. Cytokine production was evaluated in the live CD3+ CD4+ population. (A) Examples of ICS in CD4+ T cells from patients stimulated with Gag293, Gag263, or Gag161. The first 7 plots show the production of TNF-α, MIP-1β, IL-2, IL-4, IL-17, IL-21, and IL-10 combined with that of IFN-γ. The last plot on the right, second row, shows the combined expression of total intracellular perforin and of the degranulation marker CD107a, which was used to determine the cytotoxic potential of CD4+ T cells. The patient identification number and the peptide used for stimulation are indicated above each plot. (B) Quantitation of the percentage of cytokine-producing CD4+ T cells detected in HIV controllers (HIC) and treated (HAART) patients. The summed percentages of cytokine-positive cells in response to Gag161, Gag263, and Gag293 are listed. Horizontal bars indicate the median values. Significant P values (<0.05) obtained with the nonparametric Mann-Whitney U test are shown.
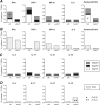
Fig 2
Analysis of intracellular cytokine production to individual Gag and CMV peptides. (A and C) The median percentage of cytokine-producing cells induced by each of the three immunodominant Gag peptides is represented in stacked columns (Gag293, gray; Gag263, black; Gag161, white). (B and D) Cytokine production induced by optimal CMV peptides chosen in the function of patients' HLA-DR alleles are represented by the hatched bars. Median cytokine responses that did not reach the detection threshold are represented by the midpoint between the threshold value of 0.01% and zero (0.005%). Significant differences obtained in the Mann-Whitney U test are indicated by the asterisks.
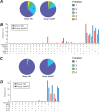
Fig 3
Polyfunctionality of Gag293-specific CD4+ T cells. (A and B) Polyfunctionality analysis for the CD107a/IFN-γ/IL-2/MIP-1β/TNF-α panel. The colors in the pie charts represent the proportions of monofunctional cells (dark blue), bifunctional cells (light blue), trifunctional cells (green), quadrifunctional cells (yellow), and pentafunctional cells (orange) within the population of Gag293-specific CD4+ T cells, as determined by ICS. The bar chart shows the frequency of Gag293-specific cells in each functional category, with red bars corresponding to HIV controllers (HIC) and dark blue bars corresponding to treated patients (HAART). *, significant difference in bifunctional cells between the HIC and HAART groups (P < 0.05). (C and D) Polyfunctionality analysis for the IFN-γ/IL-10/IL-17/IL-21 panel. The colors in the pie charts represent the proportions of monofunctional cells (dark blue), bifunctional cells (light blue), trifunctional cells (green), and quadrifunctional cells (yellow) within the population of Gag293-specific CD4+ T cells. The bar chart shows the frequency of Gag293-specific cells in each functional category. These analyses were carried out with the SPICE 5.21 program.
Fig 4
Detection of Gag293-specific CD4+ T cells by MHC class II tetramer staining. (A) Gating strategy to detect Gag293-specific cells in CD4+ T cells. Tetramer staining was analyzed in viable CD3+ CD8− CD14− CD19− CD4+ lymphocytes, starting from a minimum of 6 × 10⁶ PBMC. (B) Examples of detection of Gag293-specific cells with 4 different tetramers based on the DRB1*0101, DRB1*0701, DRB1*1101, and DRB5*0101 molecules. For each tetramer, the percentage of tetramer-positive (Tet+) cells in CD4+ T cells is indicated for one healthy donor (HD), one treated patient (HAART), and one HIV controller (HIC). A negative control consisting of CD4+ T cells labeled with a CLIP-loaded tetramer is shown for each of the HIV controllers tested (HIC-ctrl, right column).
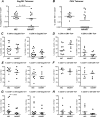
Fig 5
Frequency and phenotype of Gag293-specific tetramer-positive CD4+ T cells in HIV controllers (HIC) and treated patients (HAART). (A) The percentages of tetramer-positive (Tet+) CD4+ T cells specific for Gag293 were compared in the HIC and HAART groups. (B) The percentages of Tet+ cells specific for optimal CMV pp65 peptides were compared in the HIC and HAART groups. (C and D) The percentages of central memory (CM) (CD45RA− CCR7+) and effector memory (EM) (CD45RA− CCR7−) CD4+ T cells were analyzed in the Gag293 Tet+ population (C) and the CMV Tet+ population (D). (E and F) The percentages of CD27+ cells were analyzed in the CM and EM Gag293 Tet+ populations (E) and in the CM and EM CMV Tet+ populations (F). (G and H) The percentages of CD38+ cells were analyzed in the CM and EM Gag293 Tet+ populations (G) and in the CM and EM CMV Tet+ populations (H). The horizontal bars indicate the median values. Significant P values (<0.05) obtained with the nonparametric Mann-Whitney U test are shown.
Fig 6
Correlations between the percentages of Gag293-specific cells detected by tetramer staining and by intracellular cytokine staining (ICS). (A) Correlation between the percentage of Gag293 tetramer-positive CD4+ T cells (%Gag293 Tet+) (x axis) and the percentage of IFN-γ secreting CD4+ T cells detected by ICS after Gag293 stimulation (%IFN-γ+) (y axis) in the HIV controller (HIC) group. (B) Correlation between the percentages of Gag293 Tet+ cells and Gag293-specific IFN-γ secreting CD4+ T cells in the HAART group. (C) Correlation between the percentages of Gag293 Tet+ cells and Gag293-specific IL-17-γ-secreting CD4+ T cells in the HIC group. (D) Correlation between the percentages of Gag293 Tet+ cells and Gag293-specific IL-17-γ-secreting CD4+ T cells in the HAART group. The nonparametric Spearman correlation coefficient R and the P value are shown for each correlation.
Similar articles
- HIV controller CD4+ T cells respond to minimal amounts of Gag antigen due to high TCR avidity.
Vingert B, Perez-Patrigeon S, Jeannin P, Lambotte O, Boufassa F, Lemaître F, Kwok WW, Theodorou I, Delfraissy JF, Thèze J, Chakrabarti LA; ANRS EP36 HIV Controllers Study Group. Vingert B, et al. PLoS Pathog. 2010 Feb 26;6(2):e1000780. doi: 10.1371/journal.ppat.1000780. PLoS Pathog. 2010. PMID: 20195518 Free PMC article. - A High Frequency of HIV-Specific Circulating Follicular Helper T Cells Is Associated with Preserved Memory B Cell Responses in HIV Controllers.
Claireaux M, Galperin M, Benati D, Nouël A, Mukhopadhyay M, Klingler J, de Truchis P, Zucman D, Hendou S, Boufassa F, Moog C, Lambotte O, Chakrabarti LA. Claireaux M, et al. mBio. 2018 May 8;9(3):e00317-18. doi: 10.1128/mBio.00317-18. mBio. 2018. PMID: 29739909 Free PMC article. - Human immunodeficiency virus type 1 controllers but not noncontrollers maintain CD4 T cells coexpressing three cytokines.
Kannanganat S, Kapogiannis BG, Ibegbu C, Chennareddi L, Goepfert P, Robinson HL, Lennox J, Amara RR. Kannanganat S, et al. J Virol. 2007 Nov;81(21):12071-6. doi: 10.1128/JVI.01261-07. Epub 2007 Aug 29. J Virol. 2007. PMID: 17728221 Free PMC article. - Acquisition of direct antiviral effector functions by CMV-specific CD4+ T lymphocytes with cellular maturation.
Casazza JP, Betts MR, Price DA, Precopio ML, Ruff LE, Brenchley JM, Hill BJ, Roederer M, Douek DC, Koup RA. Casazza JP, et al. J Exp Med. 2006 Dec 25;203(13):2865-77. doi: 10.1084/jem.20052246. Epub 2006 Dec 11. J Exp Med. 2006. PMID: 17158960 Free PMC article. - Increased expression of IL-32 correlates with IFN-γ, Th1 and Tc1 in virologically suppressed HIV-1-infected patients.
Santinelli L, Statzu M, Pierangeli A, Frasca F, Bressan A, Pinacchio C, Nonne C, Turriziani O, Antonelli G, d'Ettorre G, Scagnolari C. Santinelli L, et al. Cytokine. 2019 Aug;120:273-281. doi: 10.1016/j.cyto.2019.01.012. Epub 2019 Mar 23. Cytokine. 2019. PMID: 30910260
Cited by
- Pressure from TRIM5α contributes to control of HIV-1 replication by individuals expressing protective HLA-B alleles.
Granier C, Battivelli E, Lécuroux C, Venet A, Lambotte O, Schmitt-Boulanger M, Delaugerre C, Molina JM, Chakrabarti LA, Clavel F, Hance AJ. Granier C, et al. J Virol. 2013 Sep;87(18):10368-80. doi: 10.1128/JVI.01313-13. Epub 2013 Jul 17. J Virol. 2013. PMID: 23864638 Free PMC article. - Advances in dendritic cell immunotherapies for HIV-1 infection.
Miller E, Bhardwaj N. Miller E, et al. Expert Opin Biol Ther. 2014 Nov;14(11):1545-9. doi: 10.1517/14712598.2014.950652. Epub 2014 Aug 21. Expert Opin Biol Ther. 2014. PMID: 25143151 Free PMC article. Review. - CD4 T-Cell Exhaustion: Does It Exist and What Are Its Roles in Cancer?
Miggelbrink AM, Jackson JD, Lorrey SJ, Srinivasan ES, Waibl-Polania J, Wilkinson DS, Fecci PE. Miggelbrink AM, et al. Clin Cancer Res. 2021 Nov 1;27(21):5742-5752. doi: 10.1158/1078-0432.CCR-21-0206. Epub 2021 Jun 14. Clin Cancer Res. 2021. PMID: 34127507 Free PMC article. Review. - Dendritic Cells from HIV Controllers Have Low Susceptibility to HIV-1 Infection In Vitro but High Capacity to Capture HIV-1 Particles.
Hamimi C, David A, Versmisse P, Weiss L, Bruel T, Zucman D, Appay V, Moris A, Ungeheuer MN, Lascoux-Combe C, Barré-Sinoussi F, Muller-Trutwin M, Boufassa F, Lambotte O, Pancino G, Sáez-Cirión A; ANRS CO21 CODEX cohort. Hamimi C, et al. PLoS One. 2016 Aug 9;11(8):e0160251. doi: 10.1371/journal.pone.0160251. eCollection 2016. PLoS One. 2016. PMID: 27505169 Free PMC article. - T-cell exhaustion in immune-mediated inflammatory diseases: New implications for immunotherapy.
Gao Z, Feng Y, Xu J, Liang J. Gao Z, et al. Front Immunol. 2022 Sep 23;13:977394. doi: 10.3389/fimmu.2022.977394. eCollection 2022. Front Immunol. 2022. PMID: 36211414 Free PMC article. Review.
References
- Appay V, Iglesias MC. 2011. Antigen sensitivity and T-cell receptor avidity as critical determinants of HIV control. Curr. Opin. HIV AIDS 6:157–162 - PubMed
- Appay V, et al. 2002. Characterization of CD4(+) CTLs ex vivo. J. Immunol. 168:5954–5958 - PubMed
Publication types
MeSH terms
Substances
LinkOut - more resources
Full Text Sources
Other Literature Sources
Medical
Research Materials


