Selective activation of cholinergic interneurons enhances accumbal phasic dopamine release: setting the tone for reward processing - PubMed (original) (raw)
Selective activation of cholinergic interneurons enhances accumbal phasic dopamine release: setting the tone for reward processing
Roger Cachope et al. Cell Rep. 2012.
Abstract
Dopamine plays a critical role in motor control, addiction, and reward-seeking behaviors, and its release dynamics have traditionally been linked to changes in midbrain dopamine neuron activity. Here, we report that selective endogenous cholinergic activation achieved via in vitro optogenetic stimulation of nucleus accumbens, a terminal field of dopaminergic neurons, elicits real-time dopamine release. This mechanism occurs via direct actions on dopamine terminals, does not require changes in neuron firing within the midbrain, and is dependent on glutamatergic receptor activity. More importantly, we demonstrate that in vivo selective activation of cholinergic interneurons is sufficient to elicit dopamine release in the nucleus accumbens. Therefore, the control of accumbal extracellular dopamine levels by endogenous cholinergic activity results from a complex convergence of neurotransmitter/neuromodulator systems that may ultimately synergize to drive motivated behavior.
Copyright © 2012 The Authors. Published by Elsevier Inc. All rights reserved.
Figures
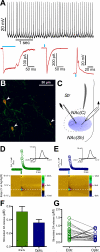
Figure 1. Selective optical stimulation of ChR2-expressing CINs elicits accumbal dopamine release
A. Top: Trace from a whole-cell recording of a YFP positive neuron (putative CIN). YFP-positive neurons displayed spontaneous, tonic firing at a rate of ~10 Hz. Bottom: Under whole-cell voltage-clamp recording from a YFP-positive neuron, blue light exposure (100 msec, left or 4 msec, middle) induced a ChR2-mediated inward current. Under whole-cell current-clamp recordings of YFP-positive neurons, delivery of a blue light pulse (4 msec, right) induced firing of a single action potential. B. Image of eYFP-positive (green) cell bodies (arrowheads) counterstained for ChAT (red) and processes from the NAc of a ChAT-Cre mouse transfected with a ChR2-eYFP viral vector. C. Scheme of the recording arrangement from coronal NAc striatal slices. DA levels were measured by FSCV through a carbon fiber microelectrode (right) while performing electrical stimulation (left) and/or optical stimulation (blue circle) delivered by an optical fiber in apposition with the tissue. D. Concentration trace (top) and color plot (bottom) for DA release triggered by electrical stimulation of the NAc. Top: Representative trace shows concentration of DA (nM) over time in response to electrical stimulation (indicated by green line). Inset shows characteristic DA voltammogram. Bottom: Corresponding color plot depicts the voltammetric data with time on the X axis, applied scan potential (Eapp) on the Y axis and background-subtracted faradaic current shown on the z-axis in pseudocolor. DA can be identified by an oxidation peak (green) at +0.6V and a smaller reduction peak (yellow) at -0.2V. E. Concentration trace (top) and color plot (bottom) for DA release triggered by optical stimulation of CINs. Top: As in D, representative trace shows concentration of DA (nM) over time in response to optical stimulation (indicated by blue line) Inset shows characteristic DA voltammogram. Bottom: Corresponding color plot of voltammetric data. F. Bar graph represents peak values of accumbal DA release obtained by electrical and optical stimulation. G. Dispersion plot indicating peak values for all the experiments performed under electrical (green circles) and optical stimulation (blue circles). Error bars represent Standard Error of the Mean (SEM).
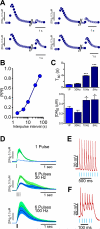
Figure 2. Frequency-dependent response of DA release evoked by stimulation of CINs
A. Average traces of DA levels evoked by paired pulses of optical stimulation of CINs delivered at 5, 10, 30 and 60 seconds intervals. B. Summary plot of DA peak amplitudes in response to paired pulse ratio stimulation of CINs. C. Top: Summary bar graph showing the average T80 decay values for DA release evoked by 5, 10, 30 Hz and single pulse stimulation. Bottom: Summary graph of peak values of DA release evoked by 5, 10, 30 Hz and single pulse stimulation. D. Average traces of DA levels triggered by different patterns of electrical stimulation, while sustained optical stimulation of CINs was being performed E. Representative traces from whole-cell recordings under current clamp of CIN neurons showing responsiveness to 10Hz optical stimulation. F. As in E., representative trace depicting CIN responsiveness to 30 Hz optical stimulation. Error shadows or bars represent SEM.
Figure 3. Modulation of DA levels evoked by endogenous cholinergic activity
A. Concentration-response plot showing the effect of increasing concentrations of the nAChR antagonist mecamylamine on DA peak levels evoked by single pulses of optical stimulation. IC = 0.61 μM. B. Effect of the β2 subunit nAChR antagonist DHβE (1 μM) on DA levels evoked by single pulse (left) and train (right) optical stimulation of CINs. C. Trace of an EPSC from a medium spiny neuron (MSN) under voltage clamp, elicited by single pulse optical stimulation of CINs. Effect of NBQX (5 μM) on the MSN EPSC. D. Effect of the application of the AMPA receptor antagonist NBQX (5 μM) on DA levels evoked by single pulse optical stimulation of CINs. E. Summary bar graph showing the effect of the mAChR antagonist scopolamine (1 μM) on DA peak levels evoked by single pulse, 5Hz and 10Hz optical stimulation of CINs, compared to pretreatment. F. Representative traces of DA concentration transients triggered by single pulse, 5Hz and 10Hz optical stimulation of CINs in the presence of scopolamine, compared to pretreatment. Error shadows or bars represent SEM.
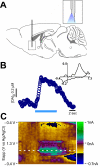
Figure 4. In vivo selective stimulation of CINs evokes accumbal DA release
A. Scheme depicting implantation of the optrode (optical fiber/carbon fiber arrangement) used to optically stimulate and record FSCV from a contiguous area in the NAc in vivo. B. Concentration trace for DA release triggered by a 7 seconds-long (20 Hz, 150 pulses, 10 mW) optical stimulation of the NAc. Representative trace shows concentration of DA (nM) over time in response to optical stimulation (indicated by blue line). Inset shows characteristic DA voltammogram. C. Corresponding color plot depicts the voltammetric data with time on the X axis, applied scan potential (Eapp) on the Y axis and background-subtracted faradaic current shown on the z-axis in pseudocolor.
Similar articles
- Dopamine neurons control striatal cholinergic neurons via regionally heterogeneous dopamine and glutamate signaling.
Chuhma N, Mingote S, Moore H, Rayport S. Chuhma N, et al. Neuron. 2014 Feb 19;81(4):901-12. doi: 10.1016/j.neuron.2013.12.027. Neuron. 2014. PMID: 24559678 Free PMC article. - p11 in Cholinergic Interneurons of the Nucleus Accumbens Is Essential for Dopamine Responses to Rewarding Stimuli.
Hanada Y, Kawahara Y, Ohnishi YN, Shuto T, Kuroiwa M, Sotogaku N, Greengard P, Sagi Y, Nishi A. Hanada Y, et al. eNeuro. 2018 Nov 8;5(5):ENEURO.0332-18.2018. doi: 10.1523/ENEURO.0332-18.2018. eCollection 2018 Sep-Oct. eNeuro. 2018. PMID: 30417079 Free PMC article. - Distinctive Modulation of Dopamine Release in the Nucleus Accumbens Shell Mediated by Dopamine and Acetylcholine Receptors.
Shin JH, Adrover MF, Alvarez VA. Shin JH, et al. J Neurosci. 2017 Nov 15;37(46):11166-11180. doi: 10.1523/JNEUROSCI.0596-17.2017. Epub 2017 Oct 13. J Neurosci. 2017. PMID: 29030431 Free PMC article. - Cholinergic modulation of dopaminergic reward areas: upstream and downstream targets of nicotine addiction.
Mansvelder HD, De Rover M, McGehee DS, Brussaard AB. Mansvelder HD, et al. Eur J Pharmacol. 2003 Nov 7;480(1-3):117-23. doi: 10.1016/j.ejphar.2003.08.099. Eur J Pharmacol. 2003. PMID: 14623355 Review. - Dopaminergic Regulation of Striatal Interneurons in Reward and Addiction: Focus on Alcohol.
Clarke R, Adermark L. Clarke R, et al. Neural Plast. 2015;2015:814567. doi: 10.1155/2015/814567. Epub 2015 Jul 13. Neural Plast. 2015. PMID: 26246915 Free PMC article. Review.
Cited by
- Enhanced heroin self-administration and distinct dopamine adaptations in female rats.
George BE, Barth SH, Kuiper LB, Holleran KM, Lacy RT, Raab-Graham KF, Jones SR. George BE, et al. Neuropsychopharmacology. 2021 Sep;46(10):1724-1733. doi: 10.1038/s41386-021-01035-0. Epub 2021 May 26. Neuropsychopharmacology. 2021. PMID: 34040157 Free PMC article. - Understanding opioid reward.
Fields HL, Margolis EB. Fields HL, et al. Trends Neurosci. 2015 Apr;38(4):217-25. doi: 10.1016/j.tins.2015.01.002. Epub 2015 Jan 29. Trends Neurosci. 2015. PMID: 25637939 Free PMC article. Review. - Role of Striatal Cholinergic Interneurons in Set-Shifting in the Rat.
Aoki S, Liu AW, Zucca A, Zucca S, Wickens JR. Aoki S, et al. J Neurosci. 2015 Jun 24;35(25):9424-31. doi: 10.1523/JNEUROSCI.0490-15.2015. J Neurosci. 2015. PMID: 26109665 Free PMC article. - Striatal Dopamine Transporter Function Is Facilitated by Converging Biology of α-Synuclein and Cholesterol.
Threlfell S, Mohammadi AS, Ryan BJ, Connor-Robson N, Platt NJ, Anand R, Serres F, Sharp T, Bengoa-Vergniory N, Wade-Martins R, Ewing A, Cragg SJ, Brimblecombe KR. Threlfell S, et al. Front Cell Neurosci. 2021 Apr 15;15:658244. doi: 10.3389/fncel.2021.658244. eCollection 2021. Front Cell Neurosci. 2021. PMID: 33935654 Free PMC article. - Local modulation by presynaptic receptors controls neuronal communication and behaviour.
Lovinger DM, Mateo Y, Johnson KA, Engi SA, Antonazzo M, Cheer JF. Lovinger DM, et al. Nat Rev Neurosci. 2022 Apr;23(4):191-203. doi: 10.1038/s41583-022-00561-0. Epub 2022 Feb 28. Nat Rev Neurosci. 2022. PMID: 35228740 Free PMC article. Review.
References
- Apicella P. Leading tonically active neurons of the striatum from reward detection to context recognition. Trends Neurosci. 2007;30:299–306. - PubMed
- Apicella P, Scarnati E, Schultz W. Tonically discharging neurons of monkey striatum respond to preparatory and rewarding stimuli. Experimental Brain Research. Experimentelle Hirnforschung. Expérimentation Cérébrale. 1991;84:672–675. - PubMed
Publication types
MeSH terms
Substances
Grants and funding
- DA022340/DA/NIDA NIH HHS/United States
- DA025890/DA/NIDA NIH HHS/United States
- ImNIH/Intramural NIH HHS/United States
- R01 DA022340/DA/NIDA NIH HHS/United States
- R21 DA033926/DA/NIDA NIH HHS/United States
- R01 DA025890/DA/NIDA NIH HHS/United States
LinkOut - more resources
Full Text Sources
Other Literature Sources


