Clostridium perfringens alpha-toxin recognizes the GM1a-TrkA complex - PubMed (original) (raw)
Clostridium perfringens alpha-toxin recognizes the GM1a-TrkA complex
Masataka Oda et al. J Biol Chem. 2012.
Abstract
Clostridium perfringens alpha-toxin is the major virulence factor in the pathogenesis of gas gangrene. Alpha-toxin is a 43-kDa protein with two structural domains; the N-domain contains the catalytic site and coordinates the divalent metal ions, and the C-domain is a membrane-binding site. The role of the exposed loop region (72-93 residues) in the N-domain, however, has been unclear. Here we show that this loop contains a ganglioside binding motif (H … SXWY … G) that is the same motif seen in botulinum neurotoxin and directly binds to a specific conformation of the ganglioside Neu5Acα2-3(Galβ1-3GalNAcβ1-4)Galβ1-4Glcβ1Cer (GM1a) through a carbohydrate moiety. Confocal microscopy analysis using fluorescently labeled BODIPY-GM1a revealed that the toxin colocalized with GM1a and induced clustering of GM1a on the cell membranes. Alpha-toxin was only slightly toxic in β1,4-N-acetylgalactosaminyltransferase knock-out mice, which lack the a-series gangliosides that contain GM1a, but was highly toxic in α2,8-sialyltransferase knock-out mice, which lack both b-series and c-series gangliosides, similar to the control mice. Moreover, experiments with site-directed mutants indicated that Trp-84 and Tyr-85 in the exposed alpha-toxin loop play an important role in the interaction with GM1a and subsequent activation of TrkA. These results suggest that binding of alpha-toxin to GM1a facilitates the activation of the TrkA receptor and induces a signal transduction cascade that promotes the release of chemokines. Therefore, we conclude that GM1a is the primary cellular receptor for alpha-toxin, which can be a potential target for drug developed against this pathogen.
Figures
FIGURE 1.
Relationship between gangliosides and release of IL-8 induced by alpha-toxin. A549 cells (1.0 × 10⁷ cells/ml) were treated with various concentrations of PPMP or neuraminidase at 37 °C for 4 days or 60 min, respectively, and then the cells were incubated with 1.0 μg/ml alpha-toxin. A, IL-8 in the culture supernatants 3 h after the addition of the toxin was determined by ELISA. Values represent the mean ± S.E.; n = 3; *, p < 0.01; **, p < 0.005, compared with the release of IL-8 in the cells treated with alpha-toxin. B, the pretreated cells with these inhibitors were incubated with Cy3-alpha-toxin for 15 min. The cells were fixed in 4% paraformaldehyde and analyzed using fluorescence microscopy. The fluorescence intensity in the visual fields was measured as described under “Experimental Procedures.” The binding of alpha-toxin to the intact cells was set as the maximal response (100%) against which all other results were compared. Values represent the mean ± S.E.; n = 3; *, p < 0.01; **, p < 0.005, compared with the binding of alpha-toxin in the untreated cells.
FIGURE 2.
Glycoarray analysis. A, the glycoarray plate was incubated with 100 μg/ml Cy3-alpha-toxin for 15 min. Fluorescence intensity of the toxin on the plate was measured with a fluorescence scanner. Values represent the mean ± S.D. *, p < 0.01 (n = 3). B, schematic figures of representative gangliosides described in the study are shown. SSEA-4 tetraose, Neu5Acα2-3Galβ1-3GalNAcβ1-3Gal; SSEA-4 hexaose, Neu5Acα2-3Galβ1-3GalNAcβ1-3Galα1-4Galβ1-4Glc.
FIGURE 3.
Localization of alpha-toxin and GM1a. A, A549 cells stained with BODIPY-GM1a (green) were incubated with 1.0 μg/ml Cy3-alpha-toxin (red) at 37 °C for 15 min. The cells were fixed in 4% paraformaldehyde and stained with Hoechst 33342. Alpha-toxin, GM1a, and nuclei were visualized using confocal laser microscopy. The data represent the means for three independent experiments. Scale bar, 10 μm. B, the percentage of colocalization was calculated for each combination of fluorescence markers by analysis of each confocal plane containing more than 30 cells. Values represent the mean ± S.E.; n = 3; *, p < 0.003, compared with the colocalization of alpha-toxin with GM1a in untreated cells. ND, not determined.
FIGURE 4.
Sensitivity of wild-type and knock-out mice to alpha-toxin. A, the red or blue frame indicates the ganglioside biosynthesis pathway that is blocked in the GalNacT−/− or ST−/− mice, respectively. Cer, ceramide; Sia, sialic acid; LacCer, lactosylceramide. B, 25-week-old male mice weighing 25–28 g were injected intraperitoneally with 200 ng of alpha-toxin. The average survival time of 4 mice is shown. C, the macrophages from various mice were incubated with alpha-toxin for the indicated periods. GRO/KC in the serum was assayed with ELISA. Values represent the mean ± S.E.; n = 3; *, p < 0.01, compared with the release of GRO/KC from wild-type mouse macrophages. D, the macrophages from various mice were incubated with Cy3-alpha-toxin (1.0 μg/ml) for 15 min are shown. The cells were fixed in 4% paraformaldehyde and analyzed using fluorescence microscopy. The data represent the mean for three independent experiments. Scale bar, 100 μm. E, the fluorescence intensity in the visual fields was measured as described under “Experimental Procedures.” The binding of alpha-toxin to the cells from wild-type mice was set as the maximal response (100%), against which all other results were compared. Values represent the mean ± S.E.; n = 3; *, p < 0.01, compared with the binding of alpha-toxin to macrophages from wild-type mice.
FIGURE 5.
Amino acid sequence alignment. The amino acid residues forming the ganglioside-binding pocket in BoNT/A, BoNT/B, TeNT, and alpha-toxin are presented as white letters on a black background. Positions of amino acids of alpha-toxin selected for mutational analyses are highlighted by asterisks above the alpha-toxin sequence.
FIGURE 6.
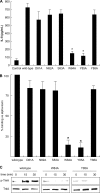
The role of amino acids coordinated at the loop region of the alpha-toxin. A, A549 cells (1 × 10⁷ cells/ml) were incubated with various toxins (1.0 μg/ml) at 37 °C for 3 h. IL-8 in the culture supernatants was assayed with an ELISA kit. Values represent the mean ± S.E.; n = 3; *, p < 0.005, compared with the release of IL-8 in the cells treated with wild-type toxin. B, A549 cells (1 × 10⁷ cells/ml) were incubated with Cy3-variant toxin (1.0 μg/ml) for 15 min. The cells were fixed in 4% paraformaldehyde and analyzed using fluorescence microscopy. The fluorescent intensity in the visual fields was measured as described under “Experimental Procedures.” The binding of wild-type toxin to the cells was set as the maximal response (100%), against which all other results were compared. Values represent the mean ± S.E.; n = 3; *, p < 0.01, compared with the binding of the wild-type toxin in A549 cells. C, A549 cells (1 × 10⁷ cells/ml) were incubated with wild-type toxin or the W84A and Y85A variants at 37 °C for 15 and 30 min. The lysates were subjected to SDS-PAGE followed by immunoblotting with antibodies against phosphorylated TrkA and TrkA. The data represent the mean for three independent experiments.
FIGURE 7.
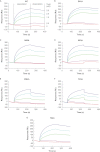
Surface plasmon resonance analysis of binding of variants to GM1a-liposomes. Binding of the wild-type toxin (A) and the D81A (B), N82A (C), S83A (D), W84A (E), Y85A (F), and Y88A (G) variants to GM1a-liposomes on L1 sensor chips was measured on a Biacore 3000. Blue, light blue, green, pink, and red lines indicate the concentrations of the variants with 5.0, 2.5, 1.0, 0.5, and 0 n
m
alpha-toxin, respectively. Association and dissociation represent the buffer in the presence or absence of the input toxins, respectively. A representative result from one of three experiments is shown.
FIGURE 8.
Binding model of alpha-toxin and the carbohydrate moiety of GM1a. A, simulation analysis of the docking of the carbohydrate moiety of GM1a onto alpha-toxin is shown. B, shown is a close-up view of the modeled interactions between the carbohydrate moiety of GM1a and Trp-84 and Tyr-85 of alpha-toxin. Hydrogen bonds are represented by dashed lines.
Similar articles
- Clostridium perfringens Alpha-Toxin Induces Gm1a Clustering and Trka Phosphorylation in the Host Cell Membrane.
Takagishi T, Oda M, Kabura M, Kurosawa M, Tominaga K, Urano S, Ueda Y, Kobayashi K, Kobayashi T, Sakurai J, Terao Y, Nagahama M. Takagishi T, et al. PLoS One. 2015 Apr 24;10(4):e0120497. doi: 10.1371/journal.pone.0120497. eCollection 2015. PLoS One. 2015. PMID: 25910247 Free PMC article. - Membrane-Binding Mechanism of Clostridium perfringens Alpha-Toxin.
Oda M, Terao Y, Sakurai J, Nagahama M. Oda M, et al. Toxins (Basel). 2015 Dec 3;7(12):5268-75. doi: 10.3390/toxins7124880. Toxins (Basel). 2015. PMID: 26633512 Free PMC article. Review. - The first strain of Clostridium perfringens isolated from an avian source has an alpha-toxin with divergent structural and kinetic properties.
Justin N, Walker N, Bullifent HL, Songer G, Bueschel DM, Jost H, Naylor C, Miller J, Moss DS, Titball RW, Basak AK. Justin N, et al. Biochemistry. 2002 May 21;41(20):6253-62. doi: 10.1021/bi012015v. Biochemistry. 2002. PMID: 12009886 - Engagement of endogenous ganglioside GM1a induces tyrosine phosphorylation involved in neuron-like differentiation of PC12 cells.
Kimura M, Hidari KI, Suzuki T, Miyamoto D, Suzuki Y. Kimura M, et al. Glycobiology. 2001 Apr;11(4):335-43. doi: 10.1093/glycob/11.4.335. Glycobiology. 2001. PMID: 11358882 - Vaccines against Clostridium perfringens alpha-toxin.
Nagahama M. Nagahama M. Curr Pharm Biotechnol. 2013;14(10):913-7. doi: 10.2174/1389201014666131226124348. Curr Pharm Biotechnol. 2013. PMID: 24372250 Review.
Cited by
- Clostridium perfringens α-toxin impairs granulocyte colony-stimulating factor receptor-mediated granulocyte production while triggering septic shock.
Takehara M, Seike S, Sonobe Y, Bandou H, Yokoyama S, Takagishi T, Miyamoto K, Kobayashi K, Nagahama M. Takehara M, et al. Commun Biol. 2019 Jan 31;2:45. doi: 10.1038/s42003-019-0280-2. eCollection 2019. Commun Biol. 2019. PMID: 30729183 Free PMC article. - Mechanisms of Action and Cell Death Associated with Clostridium perfringens Toxins.
Navarro MA, McClane BA, Uzal FA. Navarro MA, et al. Toxins (Basel). 2018 May 22;10(5):212. doi: 10.3390/toxins10050212. Toxins (Basel). 2018. PMID: 29786671 Free PMC article. Review. - Toxin plasmids of Clostridium perfringens.
Li J, Adams V, Bannam TL, Miyamoto K, Garcia JP, Uzal FA, Rood JI, McClane BA. Li J, et al. Microbiol Mol Biol Rev. 2013 Jun;77(2):208-33. doi: 10.1128/MMBR.00062-12. Microbiol Mol Biol Rev. 2013. PMID: 23699255 Free PMC article. Review. - Histotoxic Clostridial Infections.
Nagahama M, Takehara M, Rood JI. Nagahama M, et al. Microbiol Spectr. 2019 Jul 26;7(4):10.1128/microbiolspec.gpp3-0024-2018. doi: 10.1128/microbiolspec.GPP3-0024-2018. Microbiol Spectr. 2019. PMID: 31350831 Free PMC article. - Sphingolipid Metabolism Is Dysregulated at Transcriptomic and Metabolic Levels in the Spinal Cord of an Animal Model of Amyotrophic Lateral Sclerosis.
Henriques A, Croixmarie V, Bouscary A, Mosbach A, Keime C, Boursier-Neyret C, Walter B, Spedding M, Loeffler JP. Henriques A, et al. Front Mol Neurosci. 2018 Jan 4;10:433. doi: 10.3389/fnmol.2017.00433. eCollection 2017. Front Mol Neurosci. 2018. PMID: 29354030 Free PMC article.
References
- Flores-Díaz M., Alape-Girón A., Clark G., Catimel B., Hirabayashi Y., Nice E., Gutiérrez J. M., Titball R., Thelestam M. (2005) A cellular deficiency of gangliosides causes hypersensitivity to Clostridium perfringens phospholipase C. J. Biol. Chem. 280, 26680–26689 - PubMed
- Urbina P., Collado M. I., Alonso A., Goñi F. M., Flores-Díaz M., Alape-Girón A., Ruysschaert J. M., Lensink M. F. (2011) Unexpected wide substrate specificity of C. perfringens alpha-toxin phospholipase C. Biochim. Biophys. Acta 1808, 2618–2627 - PubMed
- Songer J. G. (1997) Bacterial phospholipases and their role in virulence. Trends Microbiol. 5, 156–161 - PubMed
- Stonehouse M. J., Cota-Gomez A., Parker S. K., Martin W. E., Hankin J. A., Murphy R. C., Chen W., Lim K. B., Hackett M., Vasil A. I., Vasil M. L. (2002) A novel class of microbial phosphocholine-specific phospholipases C. Mol. Microbiol. 46, 661–676 - PubMed
Publication types
MeSH terms
Substances
LinkOut - more resources
Full Text Sources
Molecular Biology Databases


