Regulation of mammalian transcription by Gdown1 through a novel steric crosstalk revealed by cryo-EM - PubMed (original) (raw)
Regulation of mammalian transcription by Gdown1 through a novel steric crosstalk revealed by cryo-EM
Yi-Min Wu et al. EMBO J. 2012.
Abstract
In mammals, a distinct RNA polymerase II form, RNAPII(G) contains a novel subunit Gdown1 (encoded by POLR2M), which represses gene activation, only to be reversed by the multisubunit Mediator co-activator. Here, we employed single-particle cryo-electron microscopy (cryo-EM) to disclose the architectures of RNAPII(G), RNAPII and RNAPII in complex with the transcription initiation factor TFIIF, all to ~19 Å. Difference analysis mapped Gdown1 mostly to the RNAPII Rpb5 shelf-Rpb1 jaw, supported by antibody labelling experiments. These structural features correlate with the moderate increase in the efficiency of RNA chain elongation by RNAP II(G). In addition, our updated RNAPII-TFIIF map showed that TFIIF tethers multiple regions surrounding the DNA-binding cleft, in agreement with cross-linking and biochemical mapping. Gdown1's binding sites overlap extensively with those of TFIIF, with Gdown1 sterically excluding TFIIF from RNAPII, herein demonstrated by competition assays using size exclusion chromatography. In summary, our work establishes a structural basis for Gdown1 impeding initiation at promoters, by obstruction of TFIIF, accounting for an additional dependent role of Mediator in activated transcription.
Conflict of interest statement
The authors declare that they have no conflict of interest.
Figures
Figure 1
Biochemical and bioinformatics characterization of RNAPII(G). (A) Purification of native RNAPII and RNAPII(G). Both forms of calf thymus RNAPII are presented in the SDS–PAGE Coomassie stained gel, with Gdown1 and the RNAPII subunits Rpb1, Rpb2, and Rpb3 labelled. By dividing the integrated intensity over the respective molecular weight, the relative amounts of Rpb1, Rpb2, and Gdown1 in RNAPII(G) were determined to be 0.81: 1: 0.74. (B) Nonspecific transcription elongation assays. 0.4 and 0.8 μg of RNAPII (lanes 1–2) and RNAPII(G) (lanes 4–5) were used for the assays as previously described (Gnatt et al, 1997). RNA fragments from the early arrest or read-through are marked. As a control, α-amanitin, an RNAPII inhibitor, was added to RNAPII (lane 3) and RNAPII(G) (lane 6), respectively. All six lanes were from the same blot and only irrelevant lanes have been removed for the figure. Lanes 1 and 2 correspond to lanes 1 and 2 in the source gel; lane 3 corresponds to lane 4 in the source gel and lanes 4–6 correspond to lanes 6–8 in the source gel. The source data has been uploaded for full information. (C) Folding analysis of Gdown1. Program FoldIndex was used to evaluate the folding propensity of Gdown1. Two folded domains found are marked in green and unfolded region in red. (D) Limited proteolysis assay performed with trypsin. Single letter amino acid codes in the predicted folded region are denoted in green in contrast to the red colour for those in the predicted unfolded region. Cleavage sites of peptide fragments identified by mass spectrometry are labelled by blue carets while protected protease sites are denoted by black carets. Figure source data can be found with the Supplementary data.
Figure 2
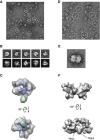
Image analyses of native bovine RNAPII complexes. (A) Native bovine RNAPII(G), enriched in monomers (white circles), were preserved in negative stain (2% uranyl acetate, 50 nm bar scale). (B) Upper row: class averages of bovine RNAPII(G) particles obtained after reference-free alignment and clustering reveal renowned RNAPII features such as groove and stalk (Rpb4/7). Lower row: re-projections from the 3D reconstruction of native RNAPII(G) that best match the class averages above. (C) EM structure of the native bovine RNAPII(G) superimposed with the yeast RNAPII X-ray structure (PDB: 1WCM). (D) Native bovine RNAPII, enriched in dimers (white circles), preserved in negative stain (50 nm scale bar scale). (E) A representative class average of RNAPII dimer. (F) 3D model of the RNAPII dimer built from reconstruction RNAPII monomers. An orientation best matches the class average in (E) shows subunit Rpb3 and Rpb4 likely participate the dimer interface.
Figure 3
Cryo-EM reconstruction of the reconstituted bovine 12-subunit RNAPII elongation complex. Three views of the cryo-EM reconstruction of bovine RNAPII elongation complex at ∼19 Å resolution (FSC 0.15). Superimposed with the EM envelop is the X-ray structure of yeast 12-subunit RNAPII (coloured ribbons) (PDB: 1Y1W). The threshold for rendering the EM reconstruction is chosen based on a molecular weight of ∼520 kDa.
Figure 4
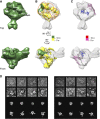
Cryo-EM reconstruction of reconstituted bovine RNAPII–Gdown1 and antibody labelling experiments. (A) Front and top views of the cryo-EM reconstruction bovine RNAPII–Gdown1 elongation at ∼19 Å resolution (FRC 0.15) are depicted as solid deep green surface models. The threshold for rendering RNAPII–Gdown1 elongation is chosen based on a molecular weight of ∼560 kDa. (B) A positive difference map was calculated between the bovine RNAPII–Gdown1 elongation and bovine RNAPII elongation complex (grey mesh) by using volumes that were both filtered to 15 Å, and shown in yellow hue above 5 σ. The most conspicuous density above 10 σ is in the gap between the Rpb5 shelf and the Rpb1 jaw is shown in deep green. (C) A negative difference map was calculated between the bovine RNAPII–Gdown1 elongation and bovine RNAPII elongation complex and shown in pink hue. The additional densities attributed to the RNAPII elongation complex are likely to be the result of conformational changes (outer densities). (D) The right panel presents RNAPII–Gdown1 EM analysis with a polyclonal antibody against Gdown1 (gift from Dr David Price, University of Iowa, USA). From top to bottom are raw negative-stained images, images filtered to 50 Å to reveal RNAPII gross features, matching projections of RNAPII at 50 Å, and the corresponding 3D models. The left panel shows a similar analysis employing a monoclonal antibody recognizing GST, fused to the N-terminus of Gdown1. Antibody densities are encircled in the top rows, and their location denoted with arrows in the lower 3D models.
Figure 5
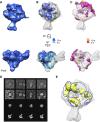
Cryo-EM reconstruction of RNAPII–TFIIF. (A) Top and front views of the cryo-EM reconstruction of bovine the RNAPII–TFIIF elongation complex at a resolution of ∼19 Å (FRC 0.15). The threshold for rendering the complex is chosen based on the total mass of the complex (∼620 kDa). (B) A positive difference map in blue hue is overlaid on the RNAPII elongation complex (grey mesh). The difference was obtained by subtracting RNAPII with nucleic acids from RNAPII–TFIIF with nucleic acid, both filtered to 15 Å. (C) A negative difference map in red hue is overlaid on the RNAPII elongation complex (grey mesh). (D) RNAPII–TFIIF images with a monoclonal antibody recognizing the GST fused to the N-terminus of TFIIF. From top to the bottom are raw negative-stained images, images filtered to 50 Å to reveal RNAPII gross features, matching projections of RNAPII at 50 Å, and the corresponding 3D models. (E) Common, overlapping regions attributed to both Gdown1 in Figure 4B (green) and regions attributed to TFIIF in Figure 5B (blue) are shown in yellow.
Figure 6
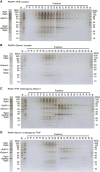
Competition assay using fractionation on a size exclusion column (Superose 6). (A) Major fractions of RNAPII–TFIIF complex (18–22) and major fractions of excess amount of free TFIIF (24–35) are visualized on SDS–PAGE with silver staining. To form RNAPII–TFIIF, eight-fold TFIIF was used. (B) Fractions of RNAPII–Gdown1 complex (20–23) and major fractions of free Gdown1 (26–28). To form RNAPII–Gdown1, four-fold Gdown1 was used (C) The RNAII–TFIIF complex challenged by Gdown1. The RNAPII-associated TFIIF (18–22) now disengages and becomes mostly free (24–35). RNAPII bound TFIIF are replaced by Gdown1 (19–22). (D) The RNAPII–Gdown1 complex challenged by TFIIF. Gdown1 remains mostly associated with RNAPII (21–24) and TFIIF remains free (25–35). Marked bands are major RNAPII subunits: Rpb1 (220 kDa), Rpb2 (133 kDa), Rpb3 (31 kDa), Rpb5 (25 kDa), TFIIF subunits: RAP74 (74 kDa), RAP30 (28 kDa), and rGdown1. In the gel, M stands for marker and L for load. The stained gel strip on the left of each panel represents ∼2.5% of the column load.
Figure 7
Steric model of Gdown1 repression and relief by Mediator. In this model, Mediator acts as a scaffold to promote the association of RNAPII with TFIIF to create an unfavourable circumstance for Gdown1 to dwell on RNAPII at the overlapping sites of TFIIF; henceforth destabilizing the association between RNAPII and Gdown1 and eventually yielding the swapping between Gdown1 and TFIIF on RNAPII to allow for transcription initiation to ensue (RNAPII is coloured in cyan, Gdown1 in green, TFIIF in blue, and Mediator in grey. PIC stands for ‘pre-initiation complex’). (A) When RNAPII(G) is recruited to the promoter, the PIC would not be generated considering the exclusion of TFIIF on RNAPII and transcription would be prevented. (B) Steric hindrance of TFIIF binding to RNAPII by Gdown1 is relieved by the Mediator complex and Mediator swaps TFIIF for Gdown1 on RNAPII. (C) Once Gdown1 is removed, promoter escape ensues with the possibility of some RNAPII enzymes to re-associate with Gdown1, in accord with recent findings of RNAPII(G) downstream of promoters (Cheng et al, 2012) and others to remain with TFIIF. Considering that RNAPII(G) is substoichiometric, it is also possible that RNAPII initiates at promoters in the absence of Gdown1 and therefore unhindered by Gdown1.
Similar articles
- Functional interactions of the RNA polymerase II-interacting proteins Gdown1 and TFIIF.
Mullen Davis MA, Guo J, Price DH, Luse DS. Mullen Davis MA, et al. J Biol Chem. 2014 Apr 18;289(16):11143-11152. doi: 10.1074/jbc.M113.544395. Epub 2014 Mar 4. J Biol Chem. 2014. PMID: 24596085 Free PMC article. - Transcriptional regulation by Pol II(G) involving mediator and competitive interactions of Gdown1 and TFIIF with Pol II.
Jishage M, Malik S, Wagner U, Uberheide B, Ishihama Y, Hu X, Chait BT, Gnatt A, Ren B, Roeder RG. Jishage M, et al. Mol Cell. 2012 Jan 13;45(1):51-63. doi: 10.1016/j.molcel.2011.12.014. Mol Cell. 2012. PMID: 22244332 Free PMC article. - Activator-mediator binding stabilizes RNA polymerase II orientation within the human mediator-RNA polymerase II-TFIIF assembly.
Bernecky C, Taatjes DJ. Bernecky C, et al. J Mol Biol. 2012 Apr 13;417(5):387-94. doi: 10.1016/j.jmb.2012.02.014. Epub 2012 Feb 16. J Mol Biol. 2012. PMID: 22343046 Free PMC article. - RNA polymerase II elongation factors use conserved regulatory mechanisms.
Chen Y, Cramer P. Chen Y, et al. Curr Opin Struct Biol. 2024 Feb;84:102766. doi: 10.1016/j.sbi.2023.102766. Epub 2024 Jan 4. Curr Opin Struct Biol. 2024. PMID: 38181687 Review. - Rethinking the role of TFIIF in transcript initiation by RNA polymerase II.
Luse DS. Luse DS. Transcription. 2012 Jul-Aug;3(4):156-9. doi: 10.4161/trns.20725. Epub 2012 Jul 1. Transcription. 2012. PMID: 22771986 Free PMC article. Review.
Cited by
- Functional interactions of the RNA polymerase II-interacting proteins Gdown1 and TFIIF.
Mullen Davis MA, Guo J, Price DH, Luse DS. Mullen Davis MA, et al. J Biol Chem. 2014 Apr 18;289(16):11143-11152. doi: 10.1074/jbc.M113.544395. Epub 2014 Mar 4. J Biol Chem. 2014. PMID: 24596085 Free PMC article. - The young person's guide to the PDB.
Minor W, Dauter Z, Jaskolski M. Minor W, et al. Postepy Biochem. 2016;62(3):242-249. doi: 10.18388/pb.2016_1. Postepy Biochem. 2016. PMID: 28132477 Free PMC article. Review. - The Mediator complex: a central integrator of transcription.
Allen BL, Taatjes DJ. Allen BL, et al. Nat Rev Mol Cell Biol. 2015 Mar;16(3):155-66. doi: 10.1038/nrm3951. Epub 2015 Feb 18. Nat Rev Mol Cell Biol. 2015. PMID: 25693131 Free PMC article. Review. - Gdown1 Associates Efficiently with RNA Polymerase II after Promoter Clearance and Displaces TFIIF during Transcript Elongation.
DeLaney E, Luse DS. DeLaney E, et al. PLoS One. 2016 Oct 7;11(10):e0163649. doi: 10.1371/journal.pone.0163649. eCollection 2016. PLoS One. 2016. PMID: 27716820 Free PMC article. - Regulation of RNA polymerase II termination by phosphorylation of Gdown1.
Guo J, Turek ME, Price DH. Guo J, et al. J Biol Chem. 2014 May 2;289(18):12657-65. doi: 10.1074/jbc.M113.537662. Epub 2014 Mar 14. J Biol Chem. 2014. PMID: 24634214 Free PMC article.
References
- Armache KJ, Mitterweger S, Meinhart A, Cramer P (2005) Structures of complete RNA polymerase II and its subcomplex, Rpb4/7. J Biol Chem 280: 7131–7134 - PubMed
- Asturias FJ, Chang W, Li Y, Kornberg RD (1998) Electron crystallography of yeast RNA polymerase II preserved in vitreous ice. Ultramicroscopy 70: 133–143 - PubMed
- Baek HJ, Kang YK, Roeder RG (2006) Human Mediator enhances basal transcription by facilitating recruitment of transcription factor IIB during preinitiation complex assembly. J Biol Chem 281: 15172–15181 - PubMed
- Belakavadi M, Fondell JD (2006) Role of the mediator complex in nuclear hormone receptor signaling. Rev Physiol Biochem Pharmacol 156: 23–43 - PubMed
Publication types
MeSH terms
Substances
LinkOut - more resources
Full Text Sources


