Detection of ultra-rare mutations by next-generation sequencing - PubMed (original) (raw)
Detection of ultra-rare mutations by next-generation sequencing
Michael W Schmitt et al. Proc Natl Acad Sci U S A. 2012.
Abstract
Next-generation DNA sequencing promises to revolutionize clinical medicine and basic research. However, while this technology has the capacity to generate hundreds of billions of nucleotides of DNA sequence in a single experiment, the error rate of ~1% results in hundreds of millions of sequencing mistakes. These scattered errors can be tolerated in some applications but become extremely problematic when "deep sequencing" genetically heterogeneous mixtures, such as tumors or mixed microbial populations. To overcome limitations in sequencing accuracy, we have developed a method termed Duplex Sequencing. This approach greatly reduces errors by independently tagging and sequencing each of the two strands of a DNA duplex. As the two strands are complementary, true mutations are found at the same position in both strands. In contrast, PCR or sequencing errors result in mutations in only one strand and can thus be discounted as technical error. We determine that Duplex Sequencing has a theoretical background error rate of less than one artifactual mutation per billion nucleotides sequenced. In addition, we establish that detection of mutations present in only one of the two strands of duplex DNA can be used to identify sites of DNA damage. We apply the method to directly assess the frequency and pattern of random mutations in mitochondrial DNA from human cells.
Conflict of interest statement
The authors declare no conflict of interest.
Figures
Fig. 1.
Overview of Duplex Sequencing. (A) Adapter synthesis. A double-stranded, randomized Duplex Tag sequence is appended to a sequencing adapter by copying a degenerate sequence in one strand of the adapter with DNA polymerase. Complete adapter A-tailing is ensured by extended incubation with polymerase and dATP. (B) Duplex Sequencing workflow. Sheared, T-tailed double-stranded DNA is ligated to A-tailed adapters. Because every adapter contains a Duplex Tag on each end, every DNA fragment becomes labeled with two distinct tag sequences (arbitrarily designated α and β in the single fragment shown). PCR amplification with primers containing Illumina flow-cell–compatible tails is carried out to generate families of PCR duplicates. Two types of PCR products are produced from each DNA fragment. Those derived from one strand will have the α tag sequence adjacent to flow cell sequence 1 and the β tag sequence adjacent to flow cell sequence 2. PCR products originating from the complementary strand are labeled reciprocally. (C) Error correction. (i_–_iii) Sequence reads sharing a unique set of tags are grouped into paired families with members having strand identifiers in either the αβ or βα orientation. Each family pair reflects the amplification of one double-stranded DNA fragment. (i) Mutations (colored spots) present in only one or a few family members represent sequencing mistakes or PCR-introduced errors occurring late in amplification. (ii) Mutations occurring in many or all members of one family in a pair arise from PCR errors during the first round of amplification such as might occur when copying across sites of mutagenic DNA damage. (iii) True mutations (green) present on both strands of a DNA fragment appear in all members of a family pair. Whereas artifactual mutations may co-occur in a family pair with a true mutation, all except those arising during the first round of PCR amplification can be independently identified and discounted when producing (iv) an error-corrected single-strand consensus sequence (SSCS). The sequences obtained from each of the two strands of an individual DNA duplex can then be compared to obtain (v) the duplex consensus sequence (DCS), which eliminates remaining errors that occurred during the first round of PCR.
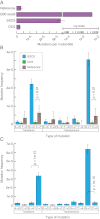
Fig. 2.
Duplex Sequencing of M13mp2 DNA. (A) Average mutation frequency of M13mp2 DNA as measured by a standard sequencing approach, SSCS, and DCS. Reference value of 3.0 × 10⁻⁶ is from ref. . Note that the axis is plotted on a split-log scale. (B) Single-strand consensus sequences (SSCSs) reveal a large excess of G→A/C→T and G→T/C→A mutations, whereas duplex consensus sequences (DCSs) yield a balanced spectrum. Mutation frequencies are grouped into reciprocal mispairs, as DCS analysis only scores mutations present in both strands of duplex DNA. All significant (P < 0.05) differences between DCS analysis and the literature reference values are noted. (C) Complementary types of mutations should occur at approximately equal frequencies within a DNA fragment population derived from duplex molecules. However, SSCS analysis yields a 15-fold excess of G→T mutations relative to C→A mutations and an 11-fold excess of C→T mutations relative to G→A mutations. All significant (P < 0.05) differences between paired reciprocal mutation frequencies are noted.
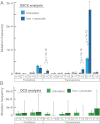
Fig. 3.
Effect of DNA damage on mutation spectrum. DNA damage was induced by incubating purified M13mp2 DNA with hydrogen peroxide and FeSO4. (A) SSCS analysis reveals a further elevation from baseline of G→T mutations, indicating these events to be the artifactual consequence of nucleotide oxidation. All significant (P < 0.05) changes from baseline mutation frequencies are noted. (B) Induced DNA damage had no effect on the overall frequency or spectrum of DCS mutations.
Fig. 4.
Duplex Sequencing of human mitochondrial DNA. (A) Overall mutation frequency as measured by a standard sequencing approach, SSCS, and DCS. (B) Pattern of mutation in human mitochondrial DNA by a standard sequencing approach. The mutation frequency (vertical axis) is plotted for every position in the ∼16-kb mitochondrial genome. Due to the substantial background of technical error, no obvious mutational pattern is discernible by this method. (C) DCS analysis eliminates sequencing artifacts and reveals the true distribution of mitochondrial mutations to include a striking excess adjacent to the mtDNA origin of replication. (D) SSCS analysis yields a large excess of G→T mutations relative to complementary C→A mutations, consistent with artifacts from damaged-induced 8-oxo-G lesions during PCR. All significant (P < 0.05) differences between paired reciprocal mutation frequencies are noted. (E) DCS analysis removes the SSCS strand bias and reveals the true mtDNA mutational spectrum to be characterized by an excess of transitions.
Comment in
- Sequence error storms and the landscape of mutations in cancer.
Kirsch S, Klein CA. Kirsch S, et al. Proc Natl Acad Sci U S A. 2012 Sep 4;109(36):14289-90. doi: 10.1073/pnas.1212246109. Epub 2012 Aug 21. Proc Natl Acad Sci U S A. 2012. PMID: 22912407 Free PMC article. No abstract available. - Über-accurate sequencing.
Rusk N. Rusk N. Nat Methods. 2012 Oct;9(10):942-3. doi: 10.1038/nmeth.2189. Nat Methods. 2012. PMID: 23193579 No abstract available.
Similar articles
- Targeted sequencing of both DNA strands barcoded and captured individually by RNA probes to identify genome-wide ultra-rare mutations.
Wang Q, Wang X, Tang PS, O'leary GM, Zhang M. Wang Q, et al. Sci Rep. 2017 Jun 13;7(1):3356. doi: 10.1038/s41598-017-03448-8. Sci Rep. 2017. PMID: 28611392 Free PMC article. - Detection of Low-Frequency Mutations and Identification of Heat-Induced Artifactual Mutations Using Duplex Sequencing.
Ahn EH, Lee SH. Ahn EH, et al. Int J Mol Sci. 2019 Jan 8;20(1):199. doi: 10.3390/ijms20010199. Int J Mol Sci. 2019. PMID: 30625989 Free PMC article. - Sequence error storms and the landscape of mutations in cancer.
Kirsch S, Klein CA. Kirsch S, et al. Proc Natl Acad Sci U S A. 2012 Sep 4;109(36):14289-90. doi: 10.1073/pnas.1212246109. Epub 2012 Aug 21. Proc Natl Acad Sci U S A. 2012. PMID: 22912407 Free PMC article. No abstract available. - Application of next-generation sequencing in the detection of low-abundance mutations.
Luan Y, You XY, Yang J. Luan Y, et al. Yi Chuan. 2024 Feb 20;46(2):126-139. doi: 10.16288/j.yczz.23-309. Yi Chuan. 2024. PMID: 38340003 Review. - Next-generation sequencing methodologies to detect low-frequency mutations: "Catch me if you can".
Menon V, Brash DE. Menon V, et al. Mutat Res Rev Mutat Res. 2023 Jul-Dec;792:108471. doi: 10.1016/j.mrrev.2023.108471. Epub 2023 Sep 15. Mutat Res Rev Mutat Res. 2023. PMID: 37716438 Free PMC article. Review.
Cited by
- Genome-wide quantification of rare somatic mutations in normal human tissues using massively parallel sequencing.
Hoang ML, Kinde I, Tomasetti C, McMahon KW, Rosenquist TA, Grollman AP, Kinzler KW, Vogelstein B, Papadopoulos N. Hoang ML, et al. Proc Natl Acad Sci U S A. 2016 Aug 30;113(35):9846-51. doi: 10.1073/pnas.1607794113. Epub 2016 Aug 15. Proc Natl Acad Sci U S A. 2016. PMID: 27528664 Free PMC article. - Clinical implementation and current advancement of blood liquid biopsy in cancer.
Watanabe K, Nakamura Y, Low SK. Watanabe K, et al. J Hum Genet. 2021 Sep;66(9):909-926. doi: 10.1038/s10038-021-00939-5. Epub 2021 Jun 4. J Hum Genet. 2021. PMID: 34088974 Review. - Estimating Exceptionally Rare Germline and Somatic Mutation Frequencies via Next Generation Sequencing.
Eboreime J, Choi SK, Yoon SR, Arnheim N, Calabrese P. Eboreime J, et al. PLoS One. 2016 Jun 24;11(6):e0158340. doi: 10.1371/journal.pone.0158340. eCollection 2016. PLoS One. 2016. PMID: 27341568 Free PMC article. - Frequency and spectrum of mutations in human sperm measured using duplex sequencing correlate with trio-based de novo mutation analyses.
Axelsson J, LeBlanc D, Shojaeisaadi H, Meier MJ, Fitzgerald DM, Nachmanson D, Carlson J, Golubeva A, Higgins J, Smith T, Lo FY, Pilsner R, Williams A, Salk J, Marchetti F, Yauk C. Axelsson J, et al. Sci Rep. 2024 Oct 8;14(1):23134. doi: 10.1038/s41598-024-73587-2. Sci Rep. 2024. PMID: 39379474 Free PMC article. - Simple, multiplexed, PCR-based barcoding of DNA enables sensitive mutation detection in liquid biopsies using sequencing.
Ståhlberg A, Krzyzanowski PM, Jackson JB, Egyud M, Stein L, Godfrey TE. Ståhlberg A, et al. Nucleic Acids Res. 2016 Jun 20;44(11):e105. doi: 10.1093/nar/gkw224. Epub 2016 Apr 7. Nucleic Acids Res. 2016. PMID: 27060140 Free PMC article.
References
- Shendure J, Ji H. Next-generation DNA sequencing. Nat Biotechnol. 2008;26:1135–1145. - PubMed
- Fordyce SL, et al. High-throughput sequencing of core STR loci for forensic genetic investigations using the Roche Genome Sequencer FLX platform. Biotechniques. 2011;51:127–133. - PubMed
Publication types
MeSH terms
Substances
Grants and funding
- P01 AG0751/AG/NIA NIH HHS/United States
- R01 CA102029/CA/NCI NIH HHS/United States
- F30 AG039173/AG/NIA NIH HHS/United States
- T32 AG000057/AG/NIA NIH HHS/United States
- T32 GM007266/GM/NIGMS NIH HHS/United States
- P01 AG001751/AG/NIA NIH HHS/United States
- R01 CA115802/CA/NCI NIH HHS/United States
- Z01 AG000751/ImNIH/Intramural NIH HHS/United States
- F30 AG033485/AG/NIA NIH HHS/United States
LinkOut - more resources
Full Text Sources
Other Literature Sources
Research Materials


