DMH1, a highly selective small molecule BMP inhibitor promotes neurogenesis of hiPSCs: comparison of PAX6 and SOX1 expression during neural induction - PubMed (original) (raw)
Comparative Study
. 2012 Jun 20;3(6):482-91.
doi: 10.1021/cn300029t. Epub 2012 Mar 5.
Affiliations
- PMID: 22860217
- PMCID: PMC3400384
- DOI: 10.1021/cn300029t
Comparative Study
DMH1, a highly selective small molecule BMP inhibitor promotes neurogenesis of hiPSCs: comparison of PAX6 and SOX1 expression during neural induction
M Diana Neely et al. ACS Chem Neurosci. 2012.
Abstract
Recent successes in deriving human-induced pluripotent stem cells (hiPSCs) allow for the possibility of studying human neurons derived from patients with neurological diseases. Concomitant inhibition of the BMP and TGF-β1 branches of the TGF-β signaling pathways by the endogenous antagonist, Noggin, and the small molecule SB431542, respectively, induces efficient neuralization of hiPSCs, a method known as dual-SMAD inhibition. The use of small molecule inhibitors instead of their endogenous counterparts has several advantages including lower cost, consistent activity, and the maintenance of xeno-free culture conditions. We tested the efficacy of DMH1, a highly selective small molecule BMP-inhibitor for its potential to replace Noggin in the neuralization of hiPSCs. We compare Noggin and DMH1-induced neuralization of hiPSCs by measuring protein and mRNA levels of pluripotency and neural precursor markers over a period of seven days. The regulation of five of the six markers assessed was indistinguishable in the presence of concentrations of Noggin or DMH1 that have been shown to effectively inhibit BMP signaling in other systems. We observed that by varying the DMH1 or Noggin concentration, we could selectively modulate the number of SOX1 expressing cells, whereas PAX6, another neural precursor marker, remained the same. The level and timing of SOX1 expression have been shown to affect neural induction as well as neural lineage. Our observations, therefore, suggest that BMP-inhibitor concentrations need to be carefully monitored to ensure appropriate expression levels of all transcription factors necessary for the induction of a particular neuronal lineage. We further demonstrate that DMH1-induced neural progenitors can be differentiated into β3-tubulin expressing neurons, a subset of which also express tyrosine hydroxylase. Thus, the combined use of DMH1, a highly specific BMP-pathway inhibitor, and SB431542, a TGF-β1-pathway specific inhibitor, provides us with the tools to independently regulate these two pathways through the exclusive use of small molecule inhibitors.
Figures
Figure 1
Pluripotency of hiPSC lines. (A) The expression of 5 pluripotency marker proteins (Nanog, SSEA-3, SSEA-4, TRA-1-60, and OCT4) was assessed in all hiPSC lines derived from patients CA, SM, PM, and TSC-12 by immunocytochemistry. All lines showed expression of all five markers. Shown here is the SM4 line derived from a patient SM. Scale bar = 200 μm. (B) Expression levels of six pluripotency markers were assessed in all hiPSC lines by real time quantitative RT-PCR (qRT-PCR). mRNA levels are expressed relative to the levels measured for the human embryonic stem cell line HES-2. The marker DNMT3B was not detectable in fibroblasts, except for the PM-fibroblast in which we measured very low levels. e = endogenous; t = total (endogenous and viral expression) (shown are mean ± STD of 4 technical replicates). (C) Teratomas generated from hiPSC contain cell lineages from all three germ layers with gastrointestinal structures (endoderm, scale bar = 100 μm), cartilage (mesoderm, scale bar = 200 μm), and neural rosettes (ectoderm, arrow heads, scale bar = 200 μm). (D) Embryoid bodies (CA6) were stained with antibodies against α-fetoprotein (α-FP, endoderm), α-smooth muscle actin (αsm-actin, mesoderm), and β3-tubulin (ectoderm). The cultures were counter stained with Hoechst dye (blue). Scale bars = 100 μm.
Figure 2
Noggin and DMH1-induced regulation of OCT4, Nanog, and PAX6 protein expression. Expression of OCT4, Nanog, and PAX6 proteins was assessed on days 1, 3, 5, and 7 of neuralization induced with SB431542 and either Noggin or DMH1. (A) Cells (SM3) were stained with antibodies against OCT4, Nanog, and PAX6 and counterstained with Hoechst dye. Scale bar in = 100 μm. (B) The percentage of OCT4-, Nanog-, and PAX6-positive cells was determined for days 1, 3, 5, and 7. (C) Noggin- and DMH1-induced PAX6 expression at day 7 is shown for eight cell lines. PAX6 data for day 7 in B (SM3 and CA6) are the same as in C. Weak signal for some of the Hoechst stained cells resulted in a slight underestimation of nuclei by automated cell counting, explaining the slightly greater than 100% PAX6 positive cells calculated for PM1. Shown are the mean ± SEM, *p < 0.05.
Figure 3
Noggin and DMH1-induced regulation of pluripotency and neural precursor marker mRNAs. (A) Expression of two hiPSC markers (OCT4, Nanog) and four neural precursor markers (PAX6, SOX1, FOXG1, and OTX2) was assessed during neuralization using dual-SMAD inhibition with SB431542 and either Noggin or DMH1 by qRT PCR over a period of 7 days. Shown are the mean values and 99.5% confidence intervals for the cell line SM5 (n = 6), D = DMH1, and N = Noggin. (B) The averaged ratios of Noggin-induced/DMH1-induced marker mRNA levels of all 9 cell lines are plotted for day 3, 5, and 7 of neuralization. Values >1 indicate higher levels in the presence of Noggin, while values <1 indicate higher expression in the presence of DMH1. Shown are the means ± SEM. Marker ratios were independent of time (day) but dependent on the marker protein (*p < 0.001, n = 9).
Figure 4
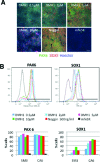
DMH1 concentration dependent SOX1 expression. hiPSCs were neuralized with DMH1 at 0.5 μM, 2 μM, 5 μM, 10 μM, or Noggin (500 ng/mL) for 7 days. Control cells were cultured in mTeSR medium for the same length of time. (A) The micrographs show SM3 cells that were stained with antibodies against PAX6 (green) and SOX1 (red) and counterstained with Hoechst dye (blue) at day 7 of neuralization. Scale bar = 100 μm. (B) PAX6- and SOX1-positive CA6 and SM3 cells were quantified by flow cytometry (traces shown are for CA6 cells). Relative frequencies of cells (_y_-axis) against fluorescence intensity (_x_-axis) and the gating used for quantification are plotted for each antibody. The percentage of PAX6 and SOX1 labeled cells for each treatment group and cell line are plotted in bar graphs.
Figure 5
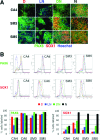
Lowering the Noggin concentration results in a decrease of SOX1 protein expression. Four different cell lines (CA4, CA6, SM3, and SM5) were neuralized with DMH1 (0.5 μM, D), a low concentration of Noggin (LN, 50 ng/mL), a combination of DMH1 and a low concentration of Noggin (50 ng/mL; DN), or a high concentration of Noggin (500 ng/mL; N). (A) The cells were stained with antibodies against PAX6 (green) and SOX1 (red), counterstained with Hoechst dye (blue), and expression assessed by fluorescence microscopy. Scale bar = 100 μm. (B) Cells stained for PAX6 and SOX1 were quantified by flow cytometry. Relative frequencies of cells (_y_-axis) against fluorescence intensity (_x_-axis) and the gating used for quantification are plotted for each antibody and cell line. The percentage of PAX6 and SOX1 labeled cells for each treatment group and cell line are plotted in bar graphs.
Figure 6
DMH1-induced neural precursors can be differentiated into β3-tubulin, tyrosine-hydroxylase positive neurons. We further differentiated DMH1-induced neural precursor cells into β3-tubulin (green), some of which expressed tyrosine-hydroxylase (red) positive neurons. Neurons tended to occur in clusters (left panel). Higher magnification images (right panel) show coexpression of β3-tubulin in tyrosine-hydroxylase positive neurons. Cultures were counterstained with Hoechst dye (blue). Scale bar in A = 100 μm and in B = 50 μm.
Similar articles
- Reprogramming fibroblasts to neural-precursor-like cells by structured overexpression of pallial patterning genes.
Raciti M, Granzotto M, Duc MD, Fimiani C, Cellot G, Cherubini E, Mallamaci A. Raciti M, et al. Mol Cell Neurosci. 2013 Nov;57:42-53. doi: 10.1016/j.mcn.2013.10.004. Epub 2013 Oct 12. Mol Cell Neurosci. 2013. PMID: 24128663 - Directing differentiation of human embryonic stem cells toward anterior neural ectoderm using small molecules.
Surmacz B, Fox H, Gutteridge A, Fish P, Lubitz S, Whiting P. Surmacz B, et al. Stem Cells. 2012 Sep;30(9):1875-84. doi: 10.1002/stem.1166. Stem Cells. 2012. PMID: 22761025 - Small molecules enable OCT4-mediated direct reprogramming into expandable human neural stem cells.
Zhu S, Ambasudhan R, Sun W, Kim HJ, Talantova M, Wang X, Zhang M, Zhang Y, Laurent T, Parker J, Kim HS, Zaremba JD, Saleem S, Sanz-Blasco S, Masliah E, McKercher SR, Cho YS, Lipton SA, Kim J, Ding S. Zhu S, et al. Cell Res. 2014 Jan;24(1):126-9. doi: 10.1038/cr.2013.156. Epub 2013 Dec 3. Cell Res. 2014. PMID: 24296783 Free PMC article. No abstract available. - Developmental malformations of the eye: the role of PAX6, SOX2 and OTX2.
Hever AM, Williamson KA, van Heyningen V. Hever AM, et al. Clin Genet. 2006 Jun;69(6):459-70. doi: 10.1111/j.1399-0004.2006.00619.x. Clin Genet. 2006. PMID: 16712695 Review. - Concise review: Pax6 transcription factor contributes to both embryonic and adult neurogenesis as a multifunctional regulator.
Osumi N, Shinohara H, Numayama-Tsuruta K, Maekawa M. Osumi N, et al. Stem Cells. 2008 Jul;26(7):1663-72. doi: 10.1634/stemcells.2007-0884. Epub 2008 May 8. Stem Cells. 2008. PMID: 18467663 Review.
Cited by
- Combinatorial polymer matrices enhance in vitro maturation of human induced pluripotent stem cell-derived cardiomyocytes.
Chun YW, Balikov DA, Feaster TK, Williams CH, Sheng CC, Lee JB, Boire TC, Neely MD, Bellan LM, Ess KC, Bowman AB, Sung HJ, Hong CC. Chun YW, et al. Biomaterials. 2015 Oct;67:52-64. doi: 10.1016/j.biomaterials.2015.07.004. Epub 2015 Jul 14. Biomaterials. 2015. PMID: 26204225 Free PMC article. - Opposing TNF-α/IL-1β- and BMP-2-activated MAPK signaling pathways converge on Runx2 to regulate BMP-2-induced osteoblastic differentiation.
Huang RL, Yuan Y, Tu J, Zou GM, Li Q. Huang RL, et al. Cell Death Dis. 2014 Apr 17;5(4):e1187. doi: 10.1038/cddis.2014.101. Cell Death Dis. 2014. PMID: 24743742 Free PMC article. - Ferulic Acid Enhances Oocyte Maturation and the Subsequent Development of Bovine Oocytes.
Wang Y, Qi JJ, Yin YJ, Jiang H, Zhang JB, Liang S, Yuan B. Wang Y, et al. Int J Mol Sci. 2023 Sep 30;24(19):14804. doi: 10.3390/ijms241914804. Int J Mol Sci. 2023. PMID: 37834252 Free PMC article. - Multiparametric rapid screening of neuronal process pathology for drug target identification in HSP patient-specific neurons.
Rehbach K, Kesavan J, Hauser S, Ritzenhofen S, Jungverdorben J, Schüle R, Schöls L, Peitz M, Brüstle O. Rehbach K, et al. Sci Rep. 2019 Jul 3;9(1):9615. doi: 10.1038/s41598-019-45246-4. Sci Rep. 2019. PMID: 31270336 Free PMC article. - Single cell RNA sequencing detects persistent cell type- and methylmercury exposure paradigm-specific effects in a human cortical neurodevelopmental model.
Diana Neely M, Xie S, Prince LM, Kim H, Tukker AM, Aschner M, Thimmapuram J, Bowman AB. Diana Neely M, et al. Food Chem Toxicol. 2021 Aug;154:112288. doi: 10.1016/j.fct.2021.112288. Epub 2021 Jun 2. Food Chem Toxicol. 2021. PMID: 34089799 Free PMC article.
References
- Takahashi K.; Tanabe K.; Ohnuki M.; Narita M.; Ichisaka T.; Tomoda K.; Yamanaka S. (2007) Induction of pluripotent stem cells from adult human fibroblasts by defined factors. Cell 131, 861–872. - PubMed
- Yu J.; Vodyanik M. A.; Smuga-Otto K.; Antosiewicz-Bourget J.; Frane J. L.; Tian S.; Nie J.; Jonsdottir G. A.; Ruotti V.; Stewart R.; Slukvin I. I.; Thomson J. A. (2007) Induced pluripotent stem cell lines derived from human somatic cells. Science 318, 1917–1920. - PubMed
- Burridge P. W.; Thompson S.; Millrod M. A.; Weinberg S.; Yuan X.; Peters A.; Mahairaki V.; Koliatsos V. E.; Tung L.; Zambidis E. T. (2011) A universal system for highly efficient cardiac differentiation of human induced pluripotent stem cells that eliminates interline variability. PLoS One 6, e18293. - PMC - PubMed
Publication types
MeSH terms
Substances
Grants and funding
- P30 ES000267/ES/NIEHS NIH HHS/United States
- R01 HL104040/HL/NHLBI NIH HHS/United States
- P30HD15052/HD/NICHD NIH HHS/United States
- U01 HL100398/HL/NHLBI NIH HHS/United States
- P01 GM085354/GM/NIGMS NIH HHS/United States
- 5U01HL100398/HL/NHLBI NIH HHS/United States
- R01 ES016931/ES/NIEHS NIH HHS/United States
- 1R01HL104010/HL/NHLBI NIH HHS/United States
- 5P30 ES000267/ES/NIEHS NIH HHS/United States
- 5P01 GM08535403/GM/NIGMS NIH HHS/United States
LinkOut - more resources
Full Text Sources
Other Literature Sources


