Regulation of embryonic and induced pluripotency by aurora kinase-p53 signaling - PubMed (original) (raw)
. 2012 Aug 3;11(2):179-94.
doi: 10.1016/j.stem.2012.05.020.
Jie Su, Yen-Sin Ang, Xonia Carvajal-Vergara, Sonia Mulero-Navarro, Carlos F Pereira, Julian Gingold, Hung-Liang Wang, Ruiying Zhao, Ana Sevilla, Henia Darr, Andrew J K Williamson, Betty Chang, Xiaohong Niu, Francesca Aguilo, Elsa R Flores, Yuh-Pyng Sher, Mien-Chie Hung, Anthony D Whetton, Bruce D Gelb, Kateri A Moore, Hans-Willem Snoeck, Avi Ma'ayan, Christoph Schaniel, Ihor R Lemischka
Affiliations
- PMID: 22862944
- PMCID: PMC3413175
- DOI: 10.1016/j.stem.2012.05.020
Regulation of embryonic and induced pluripotency by aurora kinase-p53 signaling
Dung-Fang Lee et al. Cell Stem Cell. 2012.
Abstract
Many signals must be integrated to maintain self-renewal and pluripotency in embryonic stem cells (ESCs) and to enable induced pluripotent stem cell (iPSC) reprogramming. However, the exact molecular regulatory mechanisms remain elusive. To unravel the essential internal and external signals required for sustaining the ESC state, we conducted a short hairpin (sh) RNA screen of 104 ESC-associated phosphoregulators. Depletion of one such molecule, aurora kinase A (Aurka), resulted in compromised self-renewal and consequent differentiation. By integrating global gene expression and computational analyses, we discovered that loss of Aurka leads to upregulated p53 activity that triggers ESC differentiation. Specifically, Aurka regulates pluripotency through phosphorylation-mediated inhibition of p53-directed ectodermal and mesodermal gene expression. Phosphorylation of p53 not only impairs p53-induced ESC differentiation but also p53-mediated suppression of iPSC reprogramming. Our studies demonstrate an essential role for Aurka-p53 signaling in the regulation of self-renewal, differentiation, and somatic cell reprogramming.
Copyright © 2012 Elsevier Inc. All rights reserved.
Figures
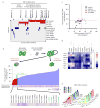
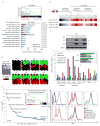
Figure 1. Identifying PKases and PPases involved in ESC self-renewal
(A) Selection of 104 gene-products for functional analyses. Heat map showing 104 candidates chosen based on several different criteria including high expression levels in ESCs, iPSCs and cancer stem cells (red), down-regulated expression upon RA-treatment, and decreased expression upon the knockdown of ESC self-renewal-associated transcription factors (TFs) (blue). Genes with no identified effects in the individual published studies are shown in gray. The x-axis represents the clustered 104 candidates identified in the individual studies. The y-axis represents the individual data sets extracted from Wong et al., 2002 [1]; Mikkelsen et al., 2008 [2]; Takahashi and Yamanaka, 2006 [3]; Pristsker et al., 2006 [4]; and Ivanova et al., 2006 [5]. The 15 molecules functionally identified in the initial stage of the screen are labeled in orange. The total numbers of times the gene-products occur in the selection criteria studies are indicated in parentheses above their names. (B) A competition strategy is used to identify the effects of PKase and PPase knockdowns on mESC self-renewal. A total of 181 shRNAs (1 to 4 per gene depending on their knockdown efficiencies) were designed targeting the 104 candidate genes. Knockdowns of 15 out of 104 genes show reduced propagation in comparison to knockdown of Lifr in CCE ESCs. (C) Knockdown effects on self-renewal of 15 candidates are validated in E14T ESCs. Depletions of 11 out of 15 genes in both CCE and E14T cells lead to a more severe competitive defect in comparison to threshold-defining knockdown of Lifr. Chek2 shRNAs (grey circles) show a significant effect on ESC self-renewal but have no effect on Chek2 mRNA expression and are likely to represent non-specific, off-target effects. (D) Heat map depiction of decreased pluripotency TF expression following 6 cell passages after knockdown of the 11 PKases and PPases. (E) Knockdown of 11 identified genes correlates with the lower staining intensity of ESC surface marker SSEA1 in comparison to a Luc control shRNA (See also Figure S1).
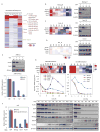
Figure 2. ESC pluripotent state is impaired upon down-regulation of Aurka expression
(A) Heat maps showing enriched expression of Aurka in pre-implantation tissues, embryonic tissues and ESCs. Gene expression data from different tissues, including embryonic stage, nervous system, blood system, bone tissue and other organs, are obtained from BioGPS using the mouse GeneAtlas GNF1M database and further analyzed by Cluster and displayed by Treeview. High and low expression levels of indicated genes in different tissues are represented in red and blue colors, respectively. (B–C) Time-course experiments demonstrate decreased expression of both Aurka mRNA and protein upon Dox withdrawl-mediated depletion of ESC pluripotency factors Nanog and Sox2 in Nanog_R and Sox2_R cells, respectively. High and low expression levels of indicated genes in Nanog_R and Sox2_R cells are represented in red and blue, respectively. (D) Withdrawal of Dox in Ctrl_R cells does not alter Aurka expression. High and low expression levels of indicated genes in Ctrl_R cells are represented in red and blue, respectively. (E) Depletion of Oct4 leads to diminished Aurka mRNA and protein expression in the Oct4-repressing ESC line ZHBTc4. qRT-PCR data are represented as mean ± SEM; n=3. (F) Transient knockdown of Nanog, Oct4, or Wdr5 by RNAi results in reduced Aurka expression in CCE cells. qRT-PCR data are represented as mean ± SEM; n=3. (G) Aurka expression decreases in parallel with pluripotency markers Nanog, Oct4 and Sox2 during EB formation and RA-induced differentiation, while differentiation markers Gata4 and Cxcl12 increase. In EB-mediated differentiation, the upper panel represents microarray transcriptome analyses during EB differentiation of J1 ESCs adapted from GSE3749, while the middle and lower panels represent qRT-PCR results and immnuoblotting data, respectively, during EB differentiation of CCE ESCs. In RA-induced differentiation, the upper panel represents microarray analyses (GSE4679) while the middle and lower panels represent qRT-PCR and immunoblotting results, respectively, from RA-treated CCE ESCs. qRT-PCR data are represented as mean ± SEM; n=3. High and low expression levels of indicated genes are represented in red and blue, respectively.
Figure 3. Aurka depletion results in loss of self-renewal and differentiation in ESCs
(A) The lentivirus-based rescue cassette contains a human U6 promoter-driven Aurka shRNA targeting the 3′UTR and a tetracycline response element (TRE) promoter driving the exogenous Aurka and GFP, expressed via an IRES element. In the absence of Dox, both Aurka and GFP are not expressed. In the presence of Dox, the exogenous Aurka is expressed and relieves the knockdown effect caused by Aurka shRNA. GFP is expressed as well. (B) Defective expression of self-renewal genes Nanog, Oct4, Sox2, Esrrb, Tbx3, Tcl1, Klf4 and Rex1 is restored in Aurka_R cells cultured for 5 days in Dox. qRT-PCR data are represented as mean ± SEM; n=3. *p<0.05 by Student’s t-test. (C) Immunoblotting shows down-regulation of Nanog, Oct4 and Esrrb 5 days after removal of Dox in Aurka_R but not Ctrl_R cells. (D) Immunostaining 5 days after Dox removal from Aurka_R cells shows decreased expression of self-renewal TFs Oct4, Nanog and Sox2. (E) ESC differentiation is apparent from the morphologies of Aurka_R cells maintained for 5 days without Dox. In contrast, Ctrl_R cells do not show any differentiation phenotype without Dox. This is consistent with shRNA-mediated knockdown results in CCE cells. The number of undifferentiated (ud), partially differentiated (pd), and fully differentiated (fd) ESC colonies are represented in the histograms. AP colony data are represented as mean ± SEM; n=3 *p<0.01 by Student’s t-test. (F) Aurka knockdown induces the expression of Brachyury/T, Bmp5, Mixl1 (mesodermal lineage), Cxcl12 and Fgf5 (ectodermal lineage). The Aurka_R cells are maintained without feeder cells in either Dox or Dox-free conditions for 5 days. (G) Immunoblotting demonstrates increased Brachyury/T (mesodermal marker) and Cxcl12 (ectodermal marker) but not Foxa2 (endodermal marker) in Aurka_R cells cultured without Dox. Expression of Brachyury/T, Cxcl12 and Foxa2 is not altered upon withdrawal of Dox in the Ctrl_R cells (See also Figures S2 and S3).
Figure 4. Up-regulation of p53 signaling after Aurka knockdown
(A) GSEA analyses identify enriched TF targets expressed either in Aurka expressing ESCs or after Aurka depletion and associated differentiation. A total of 623 TF binding motif or ChIP target gene sets are used (left panel). Normalized enrichment scores (NES) are examined and correlated with gene expression during EB formation by using a public data set (GSE3749). A positive NES (red) represents targets of selected TFs that are enriched in the transcriptome of ESCs expressing Aurka. A negative NES (blue) represents the targets of selected TFs that are enriched in the transcriptome of ESCs after Aurka depletion. Enriched gene sets are selected based on statistical significance (FDR q-value <0.25 and normalized p-value <0.05). Three examples are shown in the middle panels for E2F1 (top), Msx1 (middle) and p53 (bottom). High and low expression of indicated genes in EB samples (right panel) is represented in red and blue, respectively. (B) Expression of p53 target genes is enriched in Aurka-knockdown ESCs. High and low expression levels of indicated genes in Aurka_R cells cultured with and without Dox are represented in red and blue, respectively. (C) FDR q-valuesand normalized p-values (left panel) and heat map depiction (right panel) showing the enrichment of multiple p53 target gene sets specifically in the Aurka-associated transcript set but not in the Nanog, Esrrb or Wdr5-associated sets. Each data point represents the NES associated with loss of expression of Aurka. GSEA dataset significance is calculated at a FDR q-value <0.25 and normalized p-value <0.05 (dashed red lines in left panel). Non-significance (ns) is indicated in grey. (D) Decreased expression of pluripotency genes after loss of Aurka is rescued by knockdown of p53 by two distinct shRNAs when examined by immunoblotting (left panel) and qRT-PCR (right panel). Expression of p21Cip1 is an indicator of functional p53. Relative mRNA expression is normalized to levels in the Luc shRNA control. All data are represented as mean ± SEM; n=3. *p<0.05 by Student’s t-test for p53 shRNA2 and p53 shRNA4 versus Luc shRNA. se, shorter exposure; le, longer exposure (See also Figures S4 and S5).
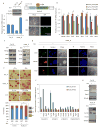
Figure 5. Aurka interacts and phosphorylates p53
(A) Two putative Aurka phosphorylation sites, Ser212 and Ser312, are found in p53. Ser212 is a classical (RXS) Aurka phosphorylation site that is evolutionarily conserved among human, mouse and xenopus. Ser312 is only conserved in human and mouse. R, arginine; X, any amino acid; S, serine. (B) Interaction between exogenously expressed p53 and Aurka. Lysates of HEK-293T cells cotransfected with Myc-tagged p53 and Flag-tagged Aurka are analyzed by reciprocal co-IP and immunoblotting using anti-tag antibodies. (C) Endogenous p53 interacts with Aurka. Lysates of mouse CCE cells are analyzed by co-IP using anti-p53 (FL-393) or control IgG antibodies and immunoblotting using anti-Aurka and anti-p53 (FL-393) antibodies. (D) Detection of the Aurka-mediated phosphorylation on p53 Ser212 and Ser312 by in vitro kinase assay. Aurka immunocomplexes are pulled-down from HEK-293T cells and incubated with the indicated Myc-tagged p53 proteins. (E) Characterization of antibodies to p-p53 (S212) and p-p53 (S312). Dot blot shows that both antibodies specifically recognize their respective phosphopeptides but not non-phosphopeptides. (F) Aurka phosphorylates p53 at Ser212 and Ser312 in vivo. Myc-tagged p53 and Flag-tagged Aurka are cotransfected into ESCs, immunoprecipitated, and analyzed with antibodies to p-p53(S212) and p-p53(S312). (G) Depletion of Aurka 2 days after Dox withdrawal decreases p-p53(S212) and p-p53(S312) levels in Aurka_R cells. (H) Phosphorylation of p53 (Ser212) is assessed using quantitative mass spectrometry with isotopomeric standards of the appropriate tryptic peptides (HSVVVPYEPPEAGSEYTTIHYK and H[pS]VVVPYEPPEAGSEYTTIHYK). Selected reaction monitoring is performed at the appropriate elution time for these peptides in biological samples spiked with the isotopomeric standards. Using this approach ratiometric values for the degree of phosphorylation in the samples are determined. (I) Cell lysates from wild-type and mutant p53 transfected together with PG13-Luc, containing wild-type p53 binding sites, and control TK-RLuc into CCE cells for 2 days are assayed for p53 activity. Luminescence ratios of PG13-Luc to TK-Rluc were calculated and normalized to vector-transfected cells. All data are represented as mean ± SEM; n=3. *p<0.01 by Student’s t-test.
Figure 6. Loss of Aurka results in p53-mediated developmental gene activation
(A) GSEA analysis indicates enriched expression of direct p53 transcriptional targets upon knockdown of Aurka and GO biological process analyses of p53 ChIP targets by Panther Classification System. (B) Diverse regulation of p53 targets (group I) and Nanog targets (group II) during EB differentiation. Gene expression is normalized to day 0. Time series expression data are analyzed by qRT-PCR and visualized by GATE. Red and green represent up- and down-regulation of gene expression, respectively. (C) Functional categorization of up-regulated p53-bound targets after Adriamycin treatment is analyzed for GO biological processes using Panther Classification System. (D) Up-regulation of p53/Nanog co-occupied target genes upon Aurka knockdown (-Dox) in two independent Aurka_R clones. (E) Ectopic expression of p53(WT) or p53(S312D) but not p53(S212D) or p53(SSDD) impairs ESC pluripotency and promotes mesodermal and ectodermal differentiation. Lentiviruses encoding wild-type and mutant p53 are transduced into CCE cells for 3 days followed by 2 days of puromycin selection. The expression of p53 is measured by immunoblotting (upper panel) and qRT-PCR (lower panel). All qRT-PCR data are represented as mean ± SEM; n=3. se, shorter exposure; le, longer exposure. (F) Ectopic expression of p53(WT) or p53(S312D) but not p53(S212D) or p53(SSDD) down regulates Nanog promoter activity. Lentiviruses encoding wild-type and mutant p53 are transduced into NG4 cells followed by 2 days of puromycin selection. Selected cells are analyzed by flow cytometry with CCE cells as a negative control.
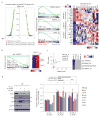
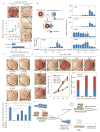
Figure 7. Suppression of p53 by Aurka is required for somatic cell reprogramming
(A) Inhibition of the reprogramming process in reprogrammable MEFs by Aurka depletion. Reprogrammed iPSC colonies after Aurka and Luc knockdown are identified by AP staining at day 9. MEF proliferation upon Aurka knockdown is determined by MTT assay. All values shown are mean ± SEM for n=3. (B) Inhibiting Aurka activity by MLN8237 suppresses nuclear reprogramming in heterokaryons. Interspecies heterokaryons are generated by PEG-mediated fusion of human B lymphocytes and mouse E14T ESCs. Induction of human embryonic genes (OCT4, NANOG, CRIPTO) and decrease of human B lymphocytic genes (CD19 and CD45) are measured to evaluate the reprogramming efficiency. (C) AP staining shows that knockdown of p53 or the Mdm2 antagonist Arf rescues the loss of Aurka-associated decreases in reprogramming efficiency in reprogrammable MEFs. Because of the rapid growth observed in Arf shRNA2 transduced MEFs, only one fourth as many cells were used compared to the other experiments. AP-positive colonies are counted in three independent experiments. All values shown are mean ± SEM for n=3. *p<0.01 by Student’s t-test. (D) p53(S212D) but not p53(S312D) loses the ability to suppress iPSC reprogramming. Various p53 phosphorylation mutants (p53(S212D), p53(S312D) and p53(SSDD)) areco-infected with OSKM factors into p53−/− MEFs. iPSC colonies are identified by AP staining (upper panel). p53−/− MEF proliferation after transduction of various p53 mutant is measured by MTT assay (lower panel, left). High and low Oct4-positive clones are identified with anti-Oct4 antibodies and scored based on expression levels (lower panel, right). Oct4-positive colonies are counted in three independent experiments. All values shown are mean ± SEM for n=3. (E) Model for the Aurka-p53 signaling axis in ESC self-renewal and iPSC reprogramming. In our proposed model, Aurka-mediated phosphorylation and consequent suppression of p53 activity impairs differentiation in ESCs and facilitates reprogramming of somatic cells (See also Figures S6 and S7).
Similar articles
- Genomic Integrity Safeguards Self-Renewal in Embryonic Stem Cells.
Su J, Zhu D, Huo Z, Gingold JA, Ang YS, Tu J, Zhou R, Lin Y, Luo H, Yang H, Zhao R, Schaniel C, Moore KA, Lemischka IR, Lee DF. Su J, et al. Cell Rep. 2019 Aug 6;28(6):1400-1409.e4. doi: 10.1016/j.celrep.2019.07.011. Cell Rep. 2019. PMID: 31390555 Free PMC article. - Nucleolin maintains embryonic stem cell self-renewal by suppression of p53 protein-dependent pathway.
Yang A, Shi G, Zhou C, Lu R, Li H, Sun L, Jin Y. Yang A, et al. J Biol Chem. 2011 Dec 16;286(50):43370-82. doi: 10.1074/jbc.M111.225185. Epub 2011 Oct 19. J Biol Chem. 2011. PMID: 22013067 Free PMC article. - Delta40p53 controls the switch from pluripotency to differentiation by regulating IGF signaling in ESCs.
Ungewitter E, Scrable H. Ungewitter E, et al. Genes Dev. 2010 Nov 1;24(21):2408-19. doi: 10.1101/gad.1987810. Genes Dev. 2010. PMID: 21041409 Free PMC article. - p53 switches off pluripotency on differentiation.
Lin T, Lin Y. Lin T, et al. Stem Cell Res Ther. 2017 Feb 28;8(1):44. doi: 10.1186/s13287-017-0498-1. Stem Cell Res Ther. 2017. PMID: 28241890 Free PMC article. Review. - Induction of pluripotency in primordial germ cells.
Kimura T, Nakano T. Kimura T, et al. Histol Histopathol. 2011 May;26(5):643-50. doi: 10.14670/HH-26.643. Histol Histopathol. 2011. PMID: 21432780 Review.
Cited by
- SETD6 monomethylates H2AZ on lysine 7 and is required for the maintenance of embryonic stem cell self-renewal.
Binda O, Sevilla A, LeRoy G, Lemischka IR, Garcia BA, Richard S. Binda O, et al. Epigenetics. 2013 Feb;8(2):177-83. doi: 10.4161/epi.23416. Epub 2013 Jan 16. Epigenetics. 2013. PMID: 23324626 Free PMC article. - LATS1/2 kinases trigger self-renewal of cancer stem cells in aggressive oral cancer.
Nozaki M, Yabuta N, Fukuzawa M, Mukai S, Okamoto A, Sasakura T, Fukushima K, Naito Y, Longmore GD, Nojima H. Nozaki M, et al. Oncotarget. 2019 Feb 1;10(10):1014-1030. doi: 10.18632/oncotarget.26583. eCollection 2019 Feb 1. Oncotarget. 2019. PMID: 30800215 Free PMC article. - Epigenetic roles of MLL oncoproteins are dependent on NF-κB.
Kuo HP, Wang Z, Lee DF, Iwasaki M, Duque-Afonso J, Wong SH, Lin CH, Figueroa ME, Su J, Lemischka IR, Cleary ML. Kuo HP, et al. Cancer Cell. 2013 Oct 14;24(4):423-37. doi: 10.1016/j.ccr.2013.08.019. Epub 2013 Sep 19. Cancer Cell. 2013. PMID: 24054986 Free PMC article. - Regulation of p53 is critical for vertebrate limb regeneration.
Yun MH, Gates PB, Brockes JP. Yun MH, et al. Proc Natl Acad Sci U S A. 2013 Oct 22;110(43):17392-7. doi: 10.1073/pnas.1310519110. Epub 2013 Oct 7. Proc Natl Acad Sci U S A. 2013. PMID: 24101460 Free PMC article. - Mechanisms for nonmitotic activation of Aurora-A at cilia.
Korobeynikov V, Deneka AY, Golemis EA. Korobeynikov V, et al. Biochem Soc Trans. 2017 Feb 8;45(1):37-49. doi: 10.1042/BST20160142. Biochem Soc Trans. 2017. PMID: 28202658 Free PMC article. Review.
References
- Badano JL, Teslovich TM, Katsanis N. The centrosome in human genetic disease. Nat Rev Genet. 2005;6:194–205. - PubMed
- Barr AR, Gergely F. Aurora-A: the maker and breaker of spindle poles. J Cell Sci. 2007;120:2987–2996. - PubMed
Publication types
MeSH terms
Substances
Grants and funding
- T32 HD075735/HD/NICHD NIH HHS/United States
- P50 GM071558/GM/NIGMS NIH HHS/United States
- 5R01GM078465/GM/NIGMS NIH HHS/United States
- R01 GM098316/GM/NIGMS NIH HHS/United States
- R01 GM078465/GM/NIGMS NIH HHS/United States
LinkOut - more resources
Full Text Sources
Molecular Biology Databases
Research Materials
Miscellaneous
