Open chromatin structures regulate the efficiencies of pre-RC formation and replication initiation in Epstein-Barr virus - PubMed (original) (raw)
Open chromatin structures regulate the efficiencies of pre-RC formation and replication initiation in Epstein-Barr virus
Peer Papior et al. J Cell Biol. 2012.
Abstract
Whether or not metazoan replication initiates at random or specific but flexible sites is an unsolved question. The lack of sequence specificity in origin recognition complex (ORC) DNA binding complicates genome-scale chromatin immunoprecipitation (ChIP)-based studies. Epstein-Barr virus (EBV) persists as chromatinized minichromosomes that are replicated by the host replication machinery. We used EBV to investigate the link between zones of pre-replication complex (pre-RC) assembly, replication initiation, and micrococcal nuclease (MNase) sensitivity at different cell cycle stages in a genome-wide fashion. The dyad symmetry element (DS) of EBV's latent origin, a well-established and very efficient pre-RC assembly region, served as an internal control. We identified 64 pre-RC zones that correlate spatially with 57 short nascent strand (SNS) zones. MNase experiments revealed that pre-RC and SNS zones were linked to regions of increased MNase sensitivity, which is a marker of origin strength. Interestingly, although spatially correlated, pre-RC and SNS zones were characterized by different features. We propose that pre-RCs are formed at flexible but distinct sites, from which only a few are activated per single genome and cell cycle.
Figures
Figure 1.
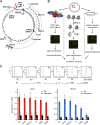
Scheme of the EBV genome and experimental design for the analyses of pre-RC and SNS zones as well as mapping of MR profiles. (A) Scheme of the circular EBV genome. In addition to the latent origins oriP (blue box) and the 14-kbp “Raji origin” (blue line), the lytic origin (oriLyt) is shown. The latent EBV nuclear antigens 1, 2, 3A–C, EBNA-LP genes (turquoise), and LMP1 and -2 (purple) are depicted, including their transcripts and promoters. The EBER1 and -2 and the miRNAs regions (BART and BARF) are indicated (green lines). The Raji genome harbors two deletions (red Δ, nt 86,000–89,000 and 163,978–166,635). These regions do not produce array signals in comparison to the reference strain type I used for the design of the EBV microarray. (B) Chart of the experimental set up to map pre-RC zones (left), MNase profiles (central), and SNS DNA (right). (C) Cell cycle phases of logarithmically growing Raji cells were separated by centrifugal elutriation. The DNA content of the different fractions was determined by FACS analysis (top, I–VI). The FACS profiles of one out of three experiments are shown. The quality of coprecipitated DNA was determined by quantitative PCR. The histograms show the mean values of three independent Orc2 (bottom left) and Mcm3 (bottom right) immunoprecipitations. The enrichments of Orc2 (red bars) and Mcm3 enrichments (blue bars) at the DS region are shown. The black bars indicate the enrichments of Orc2 and Mcm3 to a reference site. Error bars indicate mean ± SEM.
Figure 2.
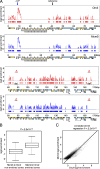
Orc2 and Mcm3 localize at highly similar locations and correlate with MSRs. (A) Orc2 and Mcm3 ChIP experiments were performed with fraction II of the elutriated Raji cells. Orc2 (red) and Mcm3 (blue) enriched zones (width ≥ 400 bp) are plotted as a function of the EBV genome. Solid lines indicate the log2 enrichments at the identified zones and the rectangles below indicate the width of each zone. EBV genes encoded in the upper strand (yellow boxes) and the lower strand (blue) are shown; repetitive elements are shown in gray. OriP and the reference site as well as the two Raji deletions (del.) are indicated. (B) A box plot analysis of Mcm3 log2 enrichment in Orc2 enriched and nonenriched zones indicates a significant difference between the mean signals. (C) A linear regression of Mcm3- and Orc2-enriched probes in pre-RC zones confirms a significant relationship between the enrichments.
Figure 3.
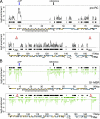
Relationship between pre-RC zones and MSRs. (A) 64 overlapping Orc2 and Mcm3 zones and Mcm3-only zones ≥ 400 bp were defined as pre-RC zones (black boxes). (B) MSRs (green), defined as regions ≥ 150 bp with negative MR versus genomic input ratios <1, overlap with pre-RC zones (black).
Figure 4.
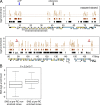
Relationship between pre-RC and SNS zones. (A) Enriched SNS zones (width ≥ 400 bp). SNS zones overlapping with at least 5% of their width with a pre-RC zone are indicated by the brown boxes. The nine nonoverlapping SNS zones are depicted as open boxes. The red line indicates the mean log2 enrichment of the weakest SNS zone. The EBV map is the same as in Fig. 2. (B) A box plot of SNS log2 enrichment at pre-RC enriched and nonenriched zones confirms a significant difference between the mean signals.
Figure 5.
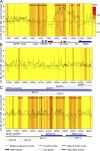
Heat map at three different EBV regions. (A–C) SNS heat map with pre-RC (black line) and G1-MNase profiles (green line). The SNS log2 enrichment efficiency at an enlargement of the oriP region (A) and two exemplary regions (B and C) is shown. The SNS values are presented as heat maps, with red and yellow indicating high and low initiation activity, respectively. Dashed black lines indicate all pre-RC log2 enrichments, whereas solid black lines represent only those pre-RC signals passing our filter for pre-RC zones. True SNS zones are marked by brown rectangles above the graph. The positions of the oriP elements FR, DS, and Rep* (red boxes), the C promoter, and the RNA Pol III transcribed EBER1 and 2 (arrows) are indicated. Latent (blue arrows) and silent lytic genes (white arrows) are depicted.
Figure 6.
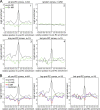
Mean MR profiles at pre-RCs are dynamic over the cell cycle.(A) Mean profile of pre-RC (black) and G1 phase MR log2 enrichments (green) in a ±1,000-bp window centered at: (1) the maximum peak of all pre-RCs (top left), (2) 250 randomly chosen locations (top right), (3) the maximum peak of the top-pre-RCs (bottom left), and (4) the maximum peak of the bot-pre-RCs (bottom right). (B) Mean profile of pre-RC (black), G1 phase MR (green), S phase MR (red), and G2/M phase MR (blue) log2 enrichments. The log2 enrichments in a ±1,000-bp window are centered at the maximum peaks of pre-RCs as in A.
Figure 7.
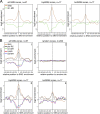
Origin activity is linked to increased MNase sensitivity.(A) Mean profile of SNS (brown) and G1-MSR log2 enrichments (green) in a ±1,000-bp window centered at the maximum peak of all SNSs (left), the topSNSs (center), and the botSNSs (right). (B) Mean profile of SNS (brown), pre-RC (black), G1-MR (green), S-MR (red), and G2/M-MR (blue) log2 enrichments in a ±1,000-bp window centered at the maximum peak of the SNS zones as described in A.
Figure 8.
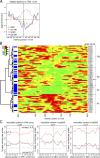
Nucleosome occupancy at TSSs, and local nucleotide composition at pre-RC and SNS zones. (A) Profiles of SNS (brown), G1-MR (green), S-MR (red), and G2/M-MR (blue) log2 enrichments in a ±1,000-bp window centered at 72 TSS. (B) Heat map of G1-MR log2 enrichments in a ±1,000-bp window centered at the 72 TSSs. The red color indicates high nucleosome resistance, whereas green indicates low. The IDs and names of the 72 genes are shown on the right axis. The dendrogram was obtained with a hierarchical cluster analysis based on the neighborhood [TSS − 250 bp, TSS + 250 bp]. Based on the dendrogram, we define four clusters of TSS: R1 (resistance,n = 22), S1 (sensitive, _n_= 9), S2 (n = 3), and R2 (n = 21). SNSs located in [TSS, TSS + 500 bp] are indicated in blue. Light blue highlights those TSSs with two SNSs. (C) Mean profile of the nucleotide base content in a ±250-bp window centered at the maximum peak of: all SNSs (left), topSNSs (center), and botSNSs (right). The nucleotide content is depicted in red for G or C and black for A or T, respectively. The gray dashed horizontal lines in each of the three panels represent the mean GC (top) or mean AT (bottom) content in the EBV genome. The red dashed line represents the mean AT content at the SNS zones.
Similar articles
- The dyad symmetry element of Epstein-Barr virus is a dominant but dispensable replication origin.
Ott E, Norio P, Ritzi M, Schildkraut C, Schepers A. Ott E, et al. PLoS One. 2011;6(5):e18609. doi: 10.1371/journal.pone.0018609. Epub 2011 May 16. PLoS One. 2011. PMID: 21603652 Free PMC article. - Structural Basis for Cooperative Binding of EBNA1 to the Epstein-Barr Virus Dyad Symmetry Minimal Origin of Replication.
Malecka KA, Dheekollu J, Deakyne JS, Wiedmer A, Ramirez UD, Lieberman PM, Messick TE. Malecka KA, et al. J Virol. 2019 Sep 30;93(20):e00487-19. doi: 10.1128/JVI.00487-19. Print 2019 Oct 15. J Virol. 2019. PMID: 31142669 Free PMC article. - Complex protein-DNA dynamics at the latent origin of DNA replication of Epstein-Barr virus.
Ritzi M, Tillack K, Gerhardt J, Ott E, Humme S, Kremmer E, Hammerschmidt W, Schepers A. Ritzi M, et al. J Cell Sci. 2003 Oct 1;116(Pt 19):3971-84. doi: 10.1242/jcs.00708. J Cell Sci. 2003. PMID: 12953058 - The origin recognition complex in human diseases.
Shen Z. Shen Z. Biosci Rep. 2013 Jun 11;33(3):e00044. doi: 10.1042/BSR20130036. Biosci Rep. 2013. PMID: 23662735 Free PMC article. Review. - Latent and lytic Epstein-Barr virus replication strategies.
Tsurumi T, Fujita M, Kudoh A. Tsurumi T, et al. Rev Med Virol. 2005 Jan-Feb;15(1):3-15. doi: 10.1002/rmv.441. Rev Med Virol. 2005. PMID: 15386591 Review.
Cited by
- Orc5 induces large-scale chromatin decondensation in a GCN5-dependent manner.
Giri S, Chakraborty A, Sathyan KM, Prasanth KV, Prasanth SG. Giri S, et al. J Cell Sci. 2016 Jan 15;129(2):417-29. doi: 10.1242/jcs.178889. Epub 2015 Dec 7. J Cell Sci. 2016. PMID: 26644179 Free PMC article. - Cis-acting DNA sequence at a replication origin promotes repeat expansion to fragile X full mutation.
Gerhardt J, Zaninovic N, Zhan Q, Madireddy A, Nolin SL, Ersalesi N, Yan Z, Rosenwaks Z, Schildkraut CL. Gerhardt J, et al. J Cell Biol. 2014 Sep 1;206(5):599-607. doi: 10.1083/jcb.201404157. J Cell Biol. 2014. PMID: 25179629 Free PMC article. - The Replicative Consequences of Papillomavirus E2 Protein Binding to the Origin Replication Factor ORC2.
DeSmet M, Kanginakudru S, Rietz A, Wu WH, Roden R, Androphy EJ. DeSmet M, et al. PLoS Pathog. 2016 Oct 4;12(10):e1005934. doi: 10.1371/journal.ppat.1005934. eCollection 2016 Oct. PLoS Pathog. 2016. PMID: 27701460 Free PMC article. - Human ORC/MCM density is low in active genes and correlates with replication time but does not delimit initiation zones.
Kirstein N, Buschle A, Wu X, Krebs S, Blum H, Kremmer E, Vorberg IM, Hammerschmidt W, Lacroix L, Hyrien O, Audit B, Schepers A. Kirstein N, et al. Elife. 2021 Mar 8;10:e62161. doi: 10.7554/eLife.62161. Elife. 2021. PMID: 33683199 Free PMC article. - Cdt1-binding protein GRWD1 is a novel histone-binding protein that facilitates MCM loading through its influence on chromatin architecture.
Sugimoto N, Maehara K, Yoshida K, Yasukouchi S, Osano S, Watanabe S, Aizawa M, Yugawa T, Kiyono T, Kurumizaka H, Ohkawa Y, Fujita M. Sugimoto N, et al. Nucleic Acids Res. 2015 Jul 13;43(12):5898-911. doi: 10.1093/nar/gkv509. Epub 2015 May 18. Nucleic Acids Res. 2015. PMID: 25990725 Free PMC article.
References
- Aladjem M.I., Falaschi A., Kowalski D. 2006. Eukaryotic DNA replication origins. DNA Replication and Human Diseases. DePamphilis M.L., editor Cold Spring Harbor Press, Cold Spring Harbor, New York: 31–63
Publication types
MeSH terms
Substances
LinkOut - more resources
Full Text Sources
