Super-resolution fluorescence imaging of organelles in live cells with photoswitchable membrane probes - PubMed (original) (raw)
Super-resolution fluorescence imaging of organelles in live cells with photoswitchable membrane probes
Sang-Hee Shim et al. Proc Natl Acad Sci U S A. 2012.
Abstract
Imaging membranes in live cells with nanometer-scale resolution promises to reveal ultrastructural dynamics of organelles that are essential for cellular functions. In this work, we identified photoswitchable membrane probes and obtained super-resolution fluorescence images of cellular membranes. We demonstrated the photoswitching capabilities of eight commonly used membrane probes, each specific to the plasma membrane, mitochondria, the endoplasmic recticulum (ER) or lysosomes. These small-molecule probes readily label live cells with high probe densities. Using these probes, we achieved dynamic imaging of specific membrane structures in living cells with 30-60 nm spatial resolution at temporal resolutions down to 1-2 s. Moreover, by using spectrally distinguishable probes, we obtained two-color super-resolution images of mitochondria and the ER. We observed previously obscured details of morphological dynamics of mitochondrial fusion/fission and ER remodeling, as well as heterogeneous membrane diffusivity on neuronal processes.
Conflict of interest statement
The authors declare no conflict of interest.
Figures
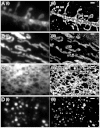
Fig. 1.
Photoswitching behavior of small-molecule probes for four membrane structures in live cells. BS-C-1 cells were labeled with (A) DiI for the plasma membrane, (B) MitoTracker Red for mitochondria, (C) ER-Tracker Red for the ER, (D) LysoTracker Red for lysosomes. Top row: Images taken with weak 561-nm illumination to excite fluorescence from these probes without switching them off appreciably. Middle row: Images taken after strong 561-nm illumination (approximately 10 kW/cm2), which turned the probes off efficiently. Bottom row: Images taken with weak 561-nm light after 405-nm light was used to turn the probes on again. Image contrasts in the middle and bottom rows were either the same as the images in the top row or increased by 6 times, as indicated. The incomplete recovery of ER- and LysoTrackers immediately after switching-off did not substantially degrade the STORM images due to the high labeling density. The recovery of ER- and LysoTrackers slowly increased and reached about 100% after 15 min of 405-nm illumination. Scale bars, 1 μm.
Fig. 2.
STORM images of four membrane organelles/structures in live cells. Conventional (i) and STORM (ii) images of (A) the plasma membrane labeled with DiI in a hippocampal neuron, (B) mitochondria labeled with MitoTracker Red in a BS-C-1 cell, (C) the ER labeled with ER-Tracker Red in a BS-C-1 cell, and (D) lysosomes labeled with LysoTracker Red in a BS-C-1 cell. The conventional fluorescence images were taken immediately before STORM imaging with a low excitation intensity to avoid switching off the dyes appreciably. The STORM images were acquired in 15 sec (A), 10 sec (B and C) and 1 sec (D). Arrowheads in A indicate spine necks along with their measured widths. Scale bars, 1 μm.
Fig. 3.
Plasma membrane dynamics in dendrites of a live hippocampal neuron at 37 °C. (A) Morphological changes of dendritic structures captured by a series of 10-sec STORM snapshots. Green arrowhead: A growing spine or filopodium. Blue arrowhead: An extending filopodium. Purple arrowhead: A retracting filopodium. (B_–_E) High-density single-particle-tracking of DiI. (B) Molecular trajectories lasting at least 15 camera frames (2 ms per frame) colored by their diffusion coefficients, D, according to the color map on the Right. (C) Diffusion coefficients in different dendritic structures. Error bars indicate standard errors: N = 613 traces for shaft; N = 90 traces for spine/filopodia. (D) A zoom-in of the boxed region in B. (E) Local distribution of diffusion coefficients within the filopodium in the dashed box in D. Error bars indicate standard errors (N = 7–18). Scale bars, 1 μm.
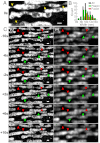
Fig. 4.
Mitochondrial dynamics in a live BS-C-1 cell. (A) A 6-sec STORM snapshot shows thin tubes connecting neighboring mitochondria (indicated by yellow arrowheads). (B) Width distribution of inter-mitochondria tubules taken from multiple cells. Black bars: All tubules. Green bars: Tubules prior to fission. Red bars: Tubules after fusion. (C) Fission (green arrowheads) and fusion (red arrowheads) events captured by a time-series of 2-sec STORM snapshots (i) and corresponding conventional images (ii). While the images were acquired continuously (
Movie S1
), only every other 2-sec snapshot is displayed here to save space. Scale bars, 500 nm.
Fig. 5.
ER dynamics in live BS-C-1 cells. (A) A time-series of 10-sec STORM snapshots. Blue arrowheads: Tips of extending tubules. (B) A composite image containing all snapshots in A with each localization colored by its time of appearance according to the color map on the Right. (C) Distribution of the widths of ER tubules. Green bars: Newly extended tubules. Red bars: Old tubules that had already existed for at least 2 min. (D) A time-series of 2-sec STORM snapshots. Blue arrowheads: Extending tubules. Purple arrowheads: Retracting tubules. Yellow arrowheads: Extending sheets. (E) A composite image containing all snapshots in D with each localization colored by the time of its appearance. Scale bars, 500 nm.
Fig. 6.
Two-color STORM images of mitochondria (green) and the ER (magenta) in a live BS-C-1 cell. The snapshots are 10 sec long. The ER tubules at the mitochondrial fission site are indicated by green arrowheads. Scale bars, 500 nm.
Comment in
- More dyes enter the realm of nanoscopy.
Evanko D. Evanko D. Nat Methods. 2012 Oct;9(10):944. doi: 10.1038/nmeth.2190. Nat Methods. 2012. PMID: 23193580 No abstract available.
Similar articles
- Green-Emitting Rhodamine Dyes for Vital Labeling of Cell Organelles Using STED Super-Resolution Microscopy.
Grimm F, Nizamov S, Belov VN. Grimm F, et al. Chembiochem. 2019 Sep 2;20(17):2248-2254. doi: 10.1002/cbic.201900177. Epub 2019 May 21. Chembiochem. 2019. PMID: 31050112 - Fast, three-dimensional super-resolution imaging of live cells.
Jones SA, Shim SH, He J, Zhuang X. Jones SA, et al. Nat Methods. 2011 Jun;8(6):499-508. doi: 10.1038/nmeth.1605. Epub 2011 May 8. Nat Methods. 2011. PMID: 21552254 Free PMC article. - Cell-permeable organic fluorescent probes for live-cell long-term super-resolution imaging reveal lysosome-mitochondrion interactions.
Han Y, Li M, Qiu F, Zhang M, Zhang YH. Han Y, et al. Nat Commun. 2017 Nov 3;8(1):1307. doi: 10.1038/s41467-017-01503-6. Nat Commun. 2017. PMID: 29101340 Free PMC article. - Small-Molecule Fluorescent Probes for Live-Cell Super-Resolution Microscopy.
Wang L, Frei MS, Salim A, Johnsson K. Wang L, et al. J Am Chem Soc. 2019 Feb 20;141(7):2770-2781. doi: 10.1021/jacs.8b11134. Epub 2019 Jan 29. J Am Chem Soc. 2019. PMID: 30550714 Review. - Examining intracellular organelle function using fluorescent probes: from animalcules to quantum dots.
Zorov DB, Kobrinsky E, Juhaszova M, Sollott SJ. Zorov DB, et al. Circ Res. 2004 Aug 6;95(3):239-52. doi: 10.1161/01.RES.0000137875.42385.8e. Circ Res. 2004. PMID: 15297386 Review.
Cited by
- Imaging interorganelle contacts at a glance.
Zanellati MC, Hsu CH, Cohen S. Zanellati MC, et al. J Cell Sci. 2024 Oct 15;137(20):jcs262020. doi: 10.1242/jcs.262020. Epub 2024 Oct 23. J Cell Sci. 2024. PMID: 39440475 Review. - Imaging and proteomics toolkits for studying organelle contact sites.
Gamuyao R, Chang CL. Gamuyao R, et al. Front Cell Dev Biol. 2024 Sep 24;12:1466915. doi: 10.3389/fcell.2024.1466915. eCollection 2024. Front Cell Dev Biol. 2024. PMID: 39381373 Free PMC article. Review. - Membrane topography and the overestimation of protein clustering in single molecule localisation microscopy - identification and correction.
Adler J, Bernhem K, Parmryd I. Adler J, et al. Commun Biol. 2024 Jun 29;7(1):791. doi: 10.1038/s42003-024-06472-3. Commun Biol. 2024. PMID: 38951588 Free PMC article. - Development and Application of Cationic Nile Blue Probes in Live-Cell Super-Resolution Imaging and Specific Targeting to Mitochondria.
Li Y, Bai X, Yang D. Li Y, et al. ACS Cent Sci. 2024 May 17;10(6):1221-1230. doi: 10.1021/acscentsci.4c00073. eCollection 2024 Jun 26. ACS Cent Sci. 2024. PMID: 38947205 Free PMC article. - Visualization of cristae and mtDNA interactions via STED nanoscopy using a low saturation power probe.
Ren W, Ge X, Li M, Sun J, Li S, Gao S, Shan C, Gao B, Xi P. Ren W, et al. Light Sci Appl. 2024 May 24;13(1):116. doi: 10.1038/s41377-024-01463-9. Light Sci Appl. 2024. PMID: 38782912 Free PMC article.
References
- McMahon HT, Gallop JL. Membrane curvature and mechanisms of dynamic cell membrane remodelling. Nature. 2005;438:590–596. - PubMed
- Shibata Y, Hu J, Kozlov MM, Rapoport TA. Mechanisms shaping the membranes of cellular organelles. Annu Rev Cell Dev Biol. 2009;25:329–354. - PubMed
- Detmer SA, Chan DC. Functions and dysfunctions of mitochondrial dynamics. Nat Rev Mol Cell Biol. 2007;8:870–879. - PubMed
- Hell SW. Microscopy and its focal switch. Nat Methods. 2009;6:24–32. - PubMed
- Heintzmann R, Gustafsson MGL. Subdiffraction resolution in continuous samples. Nat Photonics. 2009;3:362–364.
Publication types
MeSH terms
Substances
LinkOut - more resources
Full Text Sources
Other Literature Sources


