Suppression of dynamin GTPase decreases α-synuclein uptake by neuronal and oligodendroglial cells: a potent therapeutic target for synucleinopathy - PubMed (original) (raw)
Suppression of dynamin GTPase decreases α-synuclein uptake by neuronal and oligodendroglial cells: a potent therapeutic target for synucleinopathy
Masatoshi Konno et al. Mol Neurodegener. 2012.
Abstract
Background: The intracellular deposition of misfolded proteins is a common neuropathological hallmark of most neurodegenerative disorders. Increasing evidence suggests that these pathogenic proteins may spread to neighboring cells and induce the propagation of neurodegeneration.
Results: In this study, we have demonstrated that α-synuclein (αSYN), a major constituent of intracellular inclusions in synucleinopathies, was taken up by neuronal and oligodendroglial cells in both a time- and concentration-dependent manner. Once incorporated, the extracellular αSYN was immediately assembled into high-molecular-weight oligomers and subsequently formed cytoplasmic inclusion bodies. Furthermore, αSYN uptake by neurons and cells of the oligodendroglial lineage was markedly decreased by the genetic suppression and pharmacological inhibition of the dynamin GTPases, suggesting the involvement of the endocytic pathway in this process.
Conclusions: Our findings shed light on the mode of αSYN uptake by neuronal and oligodendroglial cells and identify therapeutic strategies aimed at reducing the propagation of protein misfolding.
Figures
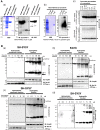
Figure 1
Extracellular α -synuclein is internalized and assembled into SDS-stable oligomers in neuronal and oligodendroglial cells. A, The characterization of recombinant αSYN. (a) The expressed GST-αSYN and tag-free αSYN were analyzed by CBB staining and western blotting with an anti-αSYN Ab (1 μg per lane). Upon IPTG induction, the transformed E. coli produced a GST-αSYN fusion protein that migrated at 44 kDa under denaturing conditions (asterisk). Following the removal of the GST-tag, monomeric αSYN was detected, which corresponded to a molecular mass of 18 kDa (arrowhead). An immunoblot using an anti-GST antibody did not detect any GST-αSYN after the removal of the GST moiety. (b) In the native condition, the absolute majority of recombinant αSYN migrated to approximately 54 kDa, corresponding to trimeric (X3) αSYN as well as some monomers (arrowhead) and oligomers (X2 and X4)/multimers. (c) Recombinant αSYN in cell-free culture medium did not self-assemble into SDS-stable oligomers after 24 hours at 37°C. B, Extracellular αSYN was incorporated and assembled into oligomers in neuronal and oligodendroglial cells. SH-SY5Y (a) and KG1C (b) cells were exposed to 5 μM αSYN for the indicated amount of time, and the cells were then subjected to fractionation and αSYN immunoblot analysis (50 μg lysate per lane). One minute after the addition of αSYN, monomeric αSYN (X1) was incorporated, and the amount of αSYN increased thereafter mainly in the hydrophilic fraction. In parallel, the SDS-resistant dimeric/trimeric αSYN (X2-X3), as well as the multimers and truncated fragments (arrow), gradually appeared in the hydrophilic fractions. Hsp90 and Na+/K+ ATPase α were used as markers for the cytosol and the plasma membrane, respectively. (c) A dose-dependent increase in intracellular monomeric (X1) and oligomeric (X2-X3) αSYN was observed mainly in the hydrophilic fractions prepared from the cells exposed to varying concentrations of recombinant αSYN (0–10 μM) for 24 hours. An asterisk indicates the non-specific band. Representative blots from three independent experiments are presented.
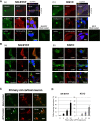
Figure 2
The formation of cytoplasmic inclusions in neuronal and oligodendroglial cells exposed to α -synuclein. A, Large perikaryal inclusions as well as small aggregates were observed in the SH-SY5Y (a) and KG1C (b) cells exposed to 5 μM recombinant αSYN for 24 hours. The αSYN-positive inclusions and small aggregates were positive for ubiquitin and thioflavin S staining, whereas only the large inclusions co-immunostained positively for phosphorylated serine 129-αSYN. Neither αSYN-positive inclusions nor small aggregates were detected in cells treated with the column flow-through. The crossed lines indicate the positions of the xz- and yz-planes. B, Double-immunolabeling studies demonstrated that the juxtanuclear large inclusions co-localized with γ-tubulin, peripherin, and/or vimentin, which are known markers of the aggresome (a and b). The αSYN-positive inclusion bodies in the KG1C cells (b) were co-localized with TPPP/p25α, a known marker for GCI in MSA. C, The formation of αSYN-positive cytoplasmic inclusions (arrowhead) was also confirmed in primary rat cortical neurons treated under the same condition. No visible αSYN-positive inclusions were detected in the mock-treated cells. D, After αSYN exposure, the incidence of perinuclear inclusions in both the SH-SY5Y and KG1C cells increased in a time-dependent manner, reaching 35% and 24%, respectively, at 24 hours. Data are expressed as the mean ± standard errors. The immunostaining was performed three times and exhibited consistent results. Scale bar: 10.0 μm.
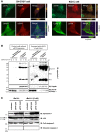
Figure 3
Lysosomal inhibition facilitates α-synuclein oligomer formation and impairs autophagic flux. A, A portion of the αSYN-positive aggregates found in the αSYN-treated SH-SY5Y cells (5 μM recombinant αSYN for 24 hours) showed partial co-localization with markers of early endosomes (Rab5A) and lysosomes (Lamp-1). The crossed lines indicate the positions of the xz- and yz-planes. Immunostaining was performed three times and exhibited consistent results. Size bar: 10.0 μm. B, Pretreatment of the cells with bafilomycin A1 (0–5 nM) increased the intracellular accumulation of the αSYN oligomers (X2 and higher) in a dose-dependent manner. Furthermore, this increase was mainly observed in the hydrophilic fractions of the αSYN-exposed cells, whereas the level of the αSYN monomer (X1) was unchanged. Fifty micrograms of lysates were analyzed by immunoblotting and the blot was probed with an anti-αSYN Ab. Hsp90 and Na+/K+ ATPase α were used as markers for the cytosol and the plasma membrane, respectively. The asterisk indicates the non-specific band. C, In the αSYN-exposed SH-SY5Y cells (5 μM recombinant αSYN for 24 hours), bafilomycin (5 nM) treatment augmented the induction of the LC3-II protein, whereas no cleaved fragments of caspase-3 were detected. Representative western blots from three independent experiments are presented.
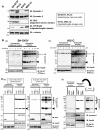
Figure 4
The inhibition of dynamin GTPases decreases the internalization of α -synuclein by neuronal and oligodendroglial cells. A, The expression profile of various dynamin isoforms across neuronal and oligodendroglial cells. Dynamin 2 was widely expressed in both types of cells, whereas dynamin 1 was strongly expressed in dopaminergic neuronal cells. However, the expression of dynamin 1 was weak (MO3.13) or absent (KG1C) in cells of the oligodendroglial lineage. Equal loading was confirmed using α-tubulin as control. B, The pharmacological inhibition of dynamin GTPase activity via sertraline treatment (0–10 μM for 30 min) dose-dependently prevented both monomeric (arrowhead) and oligomeric αSYN accumulation in SH-SY5Y (a) and KG1C (b) cells. Both cells were treated with 5 μM αSYN for 30 min with different concentrations of sertraline, as indicated. The control cells were treated with solvent (0.1% DMSO) alone. Fifty micrograms of each lysate was analyzed by immunoblotting, and the blot was probed with an anti-αSYN Ab. Hsp90 and Na+/K+ ATPase α were used as markers for the cytosol and the plasma membrane, respectively. The asterisk indicates the non-specific band. C, Consistent with the results shown in Figure 4B, the inhibition of dynamin 1 through the use of either the K44A DN mutant (a) or siRNA (b) resulted in a marked reduction of internalized αSYN in SH-SY5Y cells. Cells were treated with 5 μM αSYN (for 30 min) 48 hours after either the DN-dynamin1 transfection or the siRNA silencing of dynamin 1. Note that the αSYN monomer and the SDS-stable HMW oligomers were increased in cells overexpressing wild-type dynamin 1. Representative immunoblots from three independent experiments are shown.
Figure 5
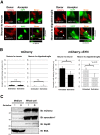
Sertraline inhibits the neuron-to-neuron and neuron-to-oligodendroglia transmission of α -synuclein in co-culture models. A, SH-SY5Y cells overexpressing mCherry or N-terminally mCherry-tagged αSYN (donor cells) were co-cultured with PC12 neuronal or MO3.13 oligodendroglial cells stably expressing EGFP (acceptor cells) in the presence or absence of 10 μM sertraline. Vehicle-only-transfected cells were treated with solvent (0.1% DMSO) only. The mCherry fluorophore was used to trace the donor-derived αSYN protein. After 72 hours of co-culture, the transmission of mCherry-αSYN from the donor cells to the acceptor PC12 as well as MO3.13 cells was detected, confirming the uptake of mCherry-αSYN secreted from the donor cells. The arrowhead indicates the transferred mCherry-αSYN-positive aggregates in the acceptor cells. The crossed lines indicate the positions of the xz- and yz-planes. B, A co-culture experiment using donor cells expressing mCherry-αSYN showed that the percentage of acceptor cells with inclusions were 4.2% (PC12) and 3.8% (MO3.13), which is much higher than the percentage of inclusion-positive cells (under 0.2% in both cell lines) co-cultured with mCherry-expressing donor cells. The addition of sertraline to the culture medium reduced the incorporation of mCherry-αSYN into the acceptor cells (*p < 0.05), whereas this effect was not observed in the acceptor cells that were co-cultured with the mCherry-expressing donor cells. To quantify the mCherry-positive inclusions in the acceptor cells, the total number of cells containing aggregates was counted per 250–300 cells within five randomly selected fields. From this value, the percentages of cells with red-fluorescent inclusions were calculated. Pooled data from four independent experiments were statistically analyzed. Data are presented as the mean ± standard errors. C, Western blot analysis demonstrated that sertraline treatment did not affect the secretion of the mCherry-αSYN from the donor SH-SY5Y cells. BSA and Hsp90 were used as markers of the culture medium and the cytosolic proteins, respectively. Each immunoblot was performed at least three times and the replicates yielded similar results.
Comment in
- Selective serotonin reuptake inhibitors emerge as the therapeutic agent for synucleinopathies.
Ozawa T. Ozawa T. Mov Disord. 2012 Nov;27(13):1614. doi: 10.1002/mds.25242. Mov Disord. 2012. PMID: 23326859 No abstract available.
Similar articles
- Systemic proteasome inhibition triggers neurodegeneration in a transgenic mouse model expressing human α-synuclein under oligodendrocyte promoter: implications for multiple system atrophy.
Stefanova N, Kaufmann WA, Humpel C, Poewe W, Wenning GK. Stefanova N, et al. Acta Neuropathol. 2012 Jul;124(1):51-65. doi: 10.1007/s00401-012-0977-5. Epub 2012 Apr 11. Acta Neuropathol. 2012. PMID: 22491959 Free PMC article. - 14-3-3 Proteins Reduce Cell-to-Cell Transfer and Propagation of Pathogenic α-Synuclein.
Wang B, Underwood R, Kamath A, Britain C, McFerrin MB, McLean PJ, Volpicelli-Daley LA, Whitaker RH, Placzek WJ, Becker K, Ma J, Yacoubian TA. Wang B, et al. J Neurosci. 2018 Sep 19;38(38):8211-8232. doi: 10.1523/JNEUROSCI.1134-18.2018. Epub 2018 Aug 9. J Neurosci. 2018. PMID: 30093536 Free PMC article. - α-Synuclein Oligomers Induce Glutamate Release from Astrocytes and Excessive Extrasynaptic NMDAR Activity in Neurons, Thus Contributing to Synapse Loss.
Trudler D, Sanz-Blasco S, Eisele YS, Ghatak S, Bodhinathan K, Akhtar MW, Lynch WP, Piña-Crespo JC, Talantova M, Kelly JW, Lipton SA. Trudler D, et al. J Neurosci. 2021 Mar 10;41(10):2264-2273. doi: 10.1523/JNEUROSCI.1871-20.2020. Epub 2021 Jan 22. J Neurosci. 2021. PMID: 33483428 Free PMC article. - The role of glia in α-synucleinopathies.
Fellner L, Stefanova N. Fellner L, et al. Mol Neurobiol. 2013 Apr;47(2):575-86. doi: 10.1007/s12035-012-8340-3. Epub 2012 Sep 2. Mol Neurobiol. 2013. PMID: 22941028 Free PMC article. Review. - Insights into the pathogenesis of multiple system atrophy: focus on glial cytoplasmic inclusions.
Kaji S, Maki T, Ishimoto T, Yamakado H, Takahashi R. Kaji S, et al. Transl Neurodegener. 2020 Feb 17;9:7. doi: 10.1186/s40035-020-0185-5. eCollection 2020. Transl Neurodegener. 2020. PMID: 32095235 Free PMC article. Review.
Cited by
- Glia and alpha-synuclein in neurodegeneration: A complex interaction.
Brück D, Wenning GK, Stefanova N, Fellner L. Brück D, et al. Neurobiol Dis. 2016 Jan;85:262-274. doi: 10.1016/j.nbd.2015.03.003. Epub 2015 Mar 10. Neurobiol Dis. 2016. PMID: 25766679 Free PMC article. Review. - VCP suppresses proteopathic seeding in neurons.
Zhu J, Pittman S, Dhavale D, French R, Patterson JN, Kaleelurrrahuman MS, Sun Y, Vaquer-Alicea J, Maggiore G, Clemen CS, Buscher WJ, Bieschke J, Kotzbauer P, Ayala Y, Diamond MI, Davis AA, Weihl C. Zhu J, et al. Mol Neurodegener. 2022 Apr 12;17(1):30. doi: 10.1186/s13024-022-00532-0. Mol Neurodegener. 2022. PMID: 35414105 Free PMC article. - Autophagy in α-Synucleinopathies-An Overstrained System.
Fellner L, Gabassi E, Haybaeck J, Edenhofer F. Fellner L, et al. Cells. 2021 Nov 12;10(11):3143. doi: 10.3390/cells10113143. Cells. 2021. PMID: 34831366 Free PMC article. Review. - Current Symptomatic and Disease-Modifying Treatments in Multiple System Atrophy.
Mészáros L, Hoffmann A, Wihan J, Winkler J. Mészáros L, et al. Int J Mol Sci. 2020 Apr 16;21(8):2775. doi: 10.3390/ijms21082775. Int J Mol Sci. 2020. PMID: 32316335 Free PMC article. Review. - Alterations in Striatal microRNA-mRNA Networks Contribute to Neuroinflammation in Multiple System Atrophy.
Kim T, Valera E, Desplats P. Kim T, et al. Mol Neurobiol. 2019 Oct;56(10):7003-7021. doi: 10.1007/s12035-019-1577-3. Epub 2019 Apr 9. Mol Neurobiol. 2019. PMID: 30968343 Free PMC article.
References
Publication types
MeSH terms
Substances
LinkOut - more resources
Full Text Sources
Medical
Research Materials
