Molecular definition of the identity and activation of natural killer cells - PubMed (original) (raw)
. 2012 Oct;13(10):1000-9.
doi: 10.1038/ni.2395. Epub 2012 Aug 19.
Collaborators, Affiliations
- PMID: 22902830
- PMCID: PMC3572860
- DOI: 10.1038/ni.2395
Molecular definition of the identity and activation of natural killer cells
Natalie A Bezman et al. Nat Immunol. 2012 Oct.
Abstract
Using whole-genome microarray data sets of the Immunological Genome Project, we demonstrate a closer transcriptional relationship between NK cells and T cells than between any other leukocytes, distinguished by their shared expression of genes encoding molecules with similar signaling functions. Whereas resting NK cells are known to share expression of a few genes with cytotoxic CD8(+) T cells, our transcriptome-wide analysis demonstrates that the commonalities extend to hundreds of genes, many encoding molecules with unknown functions. Resting NK cells demonstrate a 'preprimed' state compared with naive T cells, which allows NK cells to respond more rapidly to viral infection. Collectively, our data provide a global context for known and previously unknown molecular aspects of NK cell identity and function by delineating the genome-wide repertoire of gene expression of NK cells in various states.
Figures
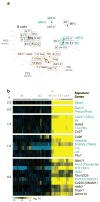
Figure 1. NK and T cells exhibit close relative similarity at the transcriptome level
(a) Splenic leukocyte populations were separated into distinct groupings by PCA. The top three PC are displayed with their percentage contributions to inter-sample variation. Individual replicate samples are displayed. (b) Significant genes discriminating the NK/T complex from other leukocyte populations are displayed as a heat map in decreasing order of significance (δ score), with individual replicates shown. Green text = molecules in the ITAM signaling pathway; blue text = molecules in the Wnt/β-catenin pathway. Common names are in parenthesis. Populations abbreviations: B T1, B cells, transitional type 1; B T2, B cells, transitional type 2; B T3, B cells, transitional type 3; B Fo, B cells, follicular; B1a, B1a B cells; B MZ, B cells, marginal zone; B GC, B cells germinal center; pDC 8−, plasmacytoid dendritic cells, CD8−; pDC 8+, plasmacytoid dendritic cells, CD8+; MF, macrophages; DC 4+, dendritic cells, CD4+; DC 8+, dendritic cells, CD8+; DC 8−4−11b+, dendritic cells, CD8−CD4−CD11b+; DC 8− 4− 11b−, dendritic cells, CD8−CD4−CD11b−; NK, natural killer cells; Tγδ, TCRγδ T cells; Treg, T regulatory cells; _i_NKT 4+, invariant NKT CD4+ cells; _i_NKT 4−, invariant NKT CD4− cells; T 4+ Nve, CD4+ naïve cells; T 8+ Nve, CD8+ naïve cells; T 4+ Mem, CD4+ memory cells; T 8+ Mem, CD8+ memory cells.
Figure 2. Organization of the innate and adaptive branches of the NK/T complex
(a) NK and innate-like T cells form distinct associations from one another and from adaptive αβ T cell populations, which group together. The top three PC are depicted with their percentage contributions to inter-sample variation. Individual replicate samples are shown. (b) Hierarchical clustering of the NK/T complex populations demonstrates close grouping of adaptive CD4+ and CD8+ T cell populations. Clustering is based on Euclidean distances of averaged arrays with a population, with all genes expressed in any of the depicted populations included in the analysis. (c) Overlap of genes expressed in NK, γδ T, and _i_NKT, but not adaptiveαβ T cell populations. Genes depicted met a δ score threshold of 0.5. Green text = effector molecules; purple = surface molecules; blue = transcription factors. Genes unique to resting NK cells are shown in Figure 3. (d,e) Flow cytometric analysis of NKR, T-bet, and Syk expression by NK and innate-like lymphocytes relative to TCRαβ+ T cells. Data represent n = 3 from 2 independent experiments. (f) Rbpms transcript level in _i_NKT and γδ T populations isolated from thymus or spleen. (g) Heat map analysis of Spry family member expression by splenic leukocyte populations. Spry3 was not expressed above background levels in any population and is not shown.
Figure 3. Molecular uniqueness of resting NK cells
(a) Heat map of genes most strongly enriched in NK cells over all other populations, shown in decreasing order of significance. A full list of genes is available in Supplementary Table 1. (b) Flow cytometric analysis of Ly49H expression in splenic leukocytes. Cells staining positive for Ly49H co-express NKp46, but not TCRγδ. Data are representative of three independent experiments. (c) Predicted regulators of resting NK cell signature genes, in decreasing order of predicted influence on the NK signature genes shown in (a).
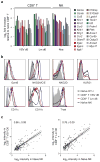
Figure 4. Naïve NK cells are primed for effector responses
(a) Genes significantly expressed in resting NK cells as compared to resting CD8+ T cells, and also induced in effector CD8+ T cells during responses to VSV and Lm are shown. Color groups represent secreted effector molecules (green), receptors (purple), integrins (red), regulatory molecules (brown), transcription factors (blue), and others (grey). Only the most significant genes are depicted (δ score > 2.0); a complete list is available in Supplementary Table 2. (b) Antibody staining of genes identified in (a) as being expressed in naïve NK cells and effector CD8+ T cells, but not naïve CD8+ T cells. Data are representative of at least two independent experiments. (c) Normalized log intensities for naïve NK cells and CD8+ T cells responding to VSV or Lm are plotted for each significant gene and subjected to linear regression. Slopes are shown with 95% confidence bands.
Figure 5. The Ly49H+ NK cell response to MCMV infection is dominated by an early activation response, followed by effector and memory responses
(a) A heat map depicting all genes significantly induced at any time point post-infection relative to naïve Ly49H+ NK cells, grouped by hierarchical clustering. (b) The day 1.5 transcriptome of Ly49H+ NK cells responding to MCMV segregates from NK cells at other times during the response. Averaged populations were organized by hierarchical clustering based on Euclidean distance using all genes expressed at any time point. (c–e) Flow cytometric surface expression of CD69, CD25, and intracellular expression of IFNγ, GzmB, pStat-1, pStat-3, pStat-4, T-bet at day 1.5 PI (c), KLRG1, CD11b, CD90, and intracellular Bcl-2 at day 7 PI (d) and Ly6c at day 27 PI (e) is shown in Ly49H+ NK cells from MCMV-infected (black histogram) or uninfected mice (gray histogram). Data are representative of three independent experiments.
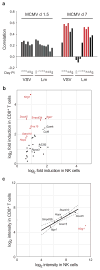
Figure 6. Common effector mechanisms of NK cells and CD8+ T cells
(a) Pearson correlations of the day 1 and day 7 NK cell responses to MCMV infection as compared to CD8+ T cell responses to VSV and Lm. The three most strongly related responses between NK cells and CD8+ T cells responding to VSV and Lm are shown in red. (b) Induction of effector genes in NK cells is muted as compared with CD8+ effector cells. Genes exhibiting greater than two-fold difference in regulation are shown in red text; additional selected representative genes are shown in black text. (c) Muted gene induction in NK cells is at least in part due to higher levels of basal expression in naïve NK cells.
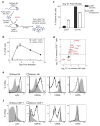
Figure 7. Common memory responses of NK cells and CD8+ T cells
(a) Wild-type NK cells (105) from C57BL/6 (CD45.1) mice were transferred into Ly49H-deficient C57BL/6 mice (CD45.2) and infected with MCMV. (b) Percentages of transferred Ly49H+ CD45.1+ and Ly49H− CD45.1+ NK cells within the total NK1.1+ TCRβ− population after MCMV infection. (c) Transferred Ly49H+ CD45.1+ and endogenous Ly49H− CD45.1+ NK cells were analyzed for CD27 and CD11b expression. (d) Genes commonly induced are shown with fold changes (FC) in each population. Selected representative genes are shown in red text. (e,f) The expression of Ly6c, CD49a, CD62L, and CD55 was assessed in (e) Ly49H+ NK cells from naïve or MCMV-infected mice (day 28 PI) or (f) OTI CD8+ T cells from naïve or VSV-infected mice (day 60 PI, except for CD62L which was measured at day 100 PI). Data are representative of at least two independent experiments.
Similar articles
- Genome wide transcriptional analysis of resting and IL2 activated human natural killer cells: gene expression signatures indicative of novel molecular signaling pathways.
Dybkaer K, Iqbal J, Zhou G, Geng H, Xiao L, Schmitz A, d'Amore F, Chan WC. Dybkaer K, et al. BMC Genomics. 2007 Jul 10;8:230. doi: 10.1186/1471-2164-8-230. BMC Genomics. 2007. PMID: 17623099 Free PMC article. - A Transcriptional Signature of PDGF-DD Activated Natural Killer Cells Predicts More Favorable Prognosis in Low-Grade Glioma.
Sun Y, Sedgwick AJ, Palarasah Y, Mangiola S, Barrow AD. Sun Y, et al. Front Immunol. 2021 Sep 2;12:668391. doi: 10.3389/fimmu.2021.668391. eCollection 2021. Front Immunol. 2021. PMID: 34539622 Free PMC article. - Transcription factor ID2 prevents E proteins from enforcing a naïve T lymphocyte gene program during NK cell development.
Zook EC, Li ZY, Xu Y, de Pooter RF, Verykokakis M, Beaulieu A, Lasorella A, Maienschein-Cline M, Sun JC, Sigvardsson M, Kee BL. Zook EC, et al. Sci Immunol. 2018 Apr 27;3(22):eaao2139. doi: 10.1126/sciimmunol.aao2139. Sci Immunol. 2018. PMID: 29703840 Free PMC article. - Surface molecules involved in the activation and regulation of T or natural killer lymphocytes in humans.
Moretta A, Ciccone E, Pantaleo G, Tambussi G, Bottino C, Melioli G, Mingari MC, Moretta L. Moretta A, et al. Immunol Rev. 1989 Oct;111:145-75. doi: 10.1111/j.1600-065x.1989.tb00545.x. Immunol Rev. 1989. PMID: 2697680 Review. - Molecular characterization of HCMV-specific immune responses: Parallels between CD8(+) T cells, CD4(+) T cells, and NK cells.
Vieira Braga FA, Hertoghs KM, van Lier RA, van Gisbergen KP. Vieira Braga FA, et al. Eur J Immunol. 2015 Sep;45(9):2433-45. doi: 10.1002/eji.201545495. Epub 2015 Aug 24. Eur J Immunol. 2015. PMID: 26228786 Review.
Cited by
- The stress response regulator HSF1 modulates natural killer cell anti-tumour immunity.
Hockemeyer K, Sakellaropoulos T, Chen X, Ivashkiv O, Sirenko M, Zhou H, Gambi G, Battistello E, Avrampou K, Sun Z, Guillamot M, Chiriboga L, Jour G, Dolgalev I, Corrigan K, Bhatt K, Osman I, Tsirigos A, Kourtis N, Aifantis I. Hockemeyer K, et al. Nat Cell Biol. 2024 Oct;26(10):1734-1744. doi: 10.1038/s41556-024-01490-z. Epub 2024 Sep 2. Nat Cell Biol. 2024. PMID: 39223375 - Dynamic Transcriptional Programs During Single NK Cell Killing: Connecting Form to Function in Cellular Immunotherapy.
Decker JT, Hall MS, Nanua D, Orbach SM, Roy J, Angadi A, Caton J, Hesse L, Jeruss JS, Shea LD. Decker JT, et al. Cell Mol Bioeng. 2024 Jul 9;17(3):177-188. doi: 10.1007/s12195-024-00812-3. eCollection 2024 Jun. Cell Mol Bioeng. 2024. PMID: 39050513 - In vivo AAV-SB-CRISPR screens of tumor-infiltrating primary NK cells identify genetic checkpoints of CAR-NK therapy.
Peng L, Renauer PA, Sferruzza G, Yang L, Zou Y, Fang Z, Park JJ, Chow RD, Zhang Y, Lin Q, Bai M, Sanchez A, Zhang Y, Lam SZ, Ye L, Chen S. Peng L, et al. Nat Biotechnol. 2024 Jun 25. doi: 10.1038/s41587-024-02282-4. Online ahead of print. Nat Biotechnol. 2024. PMID: 38918616 - HLA-DR Expression in Natural Killer Cells Marks Distinct Functional States, Depending on Cell Differentiation Stage.
Kust SA, Ustiuzhanina MO, Streltsova MA, Shelyakin PV, Kryukov MA, Lutsenko GV, Sudarikova AV, Merzlyak EM, Britanova OV, Sapozhnikov AM, Kovalenko EI. Kust SA, et al. Int J Mol Sci. 2024 Apr 23;25(9):4609. doi: 10.3390/ijms25094609. Int J Mol Sci. 2024. PMID: 38731828 Free PMC article. - Tissue-specific features of innate lymphoid cells in antiviral defense.
Piersma SJ. Piersma SJ. Cell Mol Immunol. 2024 Sep;21(9):1036-1050. doi: 10.1038/s41423-024-01161-x. Epub 2024 Apr 29. Cell Mol Immunol. 2024. PMID: 38684766 Free PMC article. Review.
References
- Heng TS, Painter MW. The Immunological Genome Project: networks of gene expression in immune cells. Nat Immunol. 2008;9:1091–1094. - PubMed
- Bendelac A, Bonneville M, Kearney JF. Autoreactivity by design: innate B and T lymphocytes. Nat Rev Immunol. 2001;1:177–186. - PubMed
- Herberman RB, Nunn ME, Holden HT, Lavrin DH. Natural cytotoxic reactivity of mouse lymphoid cells against syngeneic and allogeneic tumors. II. Characterization of effector cells. Int J Cancer. 1975;16:230–239. - PubMed
- Kiessling R, Klein E, Pross H, Wigzell H. “Natural” killer cellsin the mouse. II. Cytotoxic cells with specificity for mouse Moloney leukemia cells. Characteristics of the killer cell. Eur J Immunol. 1975;5:117–121. - PubMed
Publication types
MeSH terms
Grants and funding
- AI072117/AI/NIAID NIH HHS/United States
- T32 AI060536/AI/NIAID NIH HHS/United States
- CAPMC/ CIHR/Canada
- T32AI060537/AI/NIAID NIH HHS/United States
- T32 AI060537/AI/NIAID NIH HHS/United States
- R01 AI100874/AI/NIAID NIH HHS/United States
- R00 AI085035/AI/NIAID NIH HHS/United States
- R01 AI068129/AI/NIAID NIH HHS/United States
- R24 AI072073/AI/NIAID NIH HHS/United States
- T32AI060536/AI/NIAID NIH HHS/United States
- R37 AI067545/AI/NIAID NIH HHS/United States
LinkOut - more resources
Full Text Sources
Other Literature Sources
Research Materials


