Translation termination efficiency modulates ATF4 response by regulating ATF4 mRNA translation at 5' short ORFs - PubMed (original) (raw)
Translation termination efficiency modulates ATF4 response by regulating ATF4 mRNA translation at 5' short ORFs
Hayet Ait Ghezala et al. Nucleic Acids Res. 2012 Oct.
Abstract
The activating transcription factor 4 (ATF4) promotes transcriptional upregulation of specific target genes in response to cellular stress. ATF4 expression is regulated at the translational level by two short open reading frames (uORFs) in its 5'-untranslated region (5'-UTR). Here, we describe a mechanism regulating ATF4 expression in translation termination-deficient human cells. Using microarray analysis of total RNA and polysome-associated mRNAs, we show that depletion of the eucaryotic release factor 3a (eRF3a) induces upregulation of ATF4 and of ATF4 target genes. We show that eRF3a depletion modifies ATF4 translational control at regulatory uORFs increasing ATF4 ORF translation. Finally, we show that the increase of REDD1 expression, one of the upregulated targets of ATF4, is responsible for the mTOR pathway inhibition in eRF3a-depleted cells. Our results shed light on the molecular mechanisms connecting eRF3a depletion to mammalian target of rapamycin (mTOR) pathway inhibition and give an example of ATF4 activation that bypasses the signal transduction cascade leading to the phosphorylation of eIF2α. We propose that in mammals, in which the 5'-UTR regulatory elements of ATF4 mRNA are strictly conserved, variations in translation termination efficiency allow the modulation of the ATF4 response.
Figures
Figure 1.
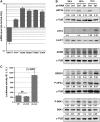
eRF3a depletion activates the ATF4 response. (A) qRT-PCR performed on total RNA of HCT116 cells 3 days after electroporation with shRNA targeting eRF3a mRNA (sh-3a1) or control shRNA (sh-Ctrl). The ratio of mRNA levels in sh-3a1 versus sh-Ctrl electroporated cells was calculated. Bars and error bars correspond to averages and SD from at least three independent experiments. mRNA levels of ATF4, selected targets of ATF4 (ASNS, REDD1, TRIB3 and CHOP) and GSPT1-encoding eRF3a are shown. (B) Western blot analysis of the time course of expression of eRF3a, total S6K1, S6K1 phosphorylated form (P-S6K1), ATF4, ASNS, REDD1 and the phosphorylated form of eIF2α (P-eIF2α) at 24, 48 and 72 h, respectively, after electroporation of cells with sh-3a1 or sh-Ctrl as indicated; α-TUB and β-ACT served as loading controls. Quantification of the signals (see ‘Materials and Methods’ section) are shown below each panel. Each signal was divided by the signal elicited by the reference protein, either α-TUB or β-ACT. For each time point, the control experiment was set to 1 (ND, not detected). (C) The 2XAARE-TRIB3-TKLUC cell line that expresses a Luc reporter driven by two AAREs upstream of the TK minimal promoter was electroporated with sh-3a1 or sh-Ctrl; (NT) corresponds to non-treated cells. Luciferase activity was calculated as the ratio of light units to microgram of protein and expressed as RLU. Bars and error bars correspond to averages and SD from three independent experiments. _P_-values (two-tailed Student’s _t_-test) are indicated for the relevant samples.
Figure 2.
ATF4 stability in HCT116 cells after electroporation with control shRNA (sh-Ctrl) or shRNAs targeting either eRF3a mRNA (sh-3a1) or Upf1 mRNA (sh-Upf1). Two days after electroporation, cells were treated with Actinomycin D (5 µg/ml) for various time as indicated and total RNA was extracted. (A) After RNA separation on denaturing agarose gel, northern blot analysis was performed using ATF4 and B2M probes (B2M probe served as a loading control). (B) The signals were quantified using the Storm 860 Imaging system (Molecular Dynamics) and the ImageQuant software, and plotted as the ratio of ATF4 to B2M signals. Half-lives and decay constants were calculated from the regression curves.
Figure 3.
eRF3a depletion increases ATF4 ORF translation. Two days after electroporation with shRNA targeting eRF3a mRNA (sh-3a1) or control shRNA (sh-Ctrl), cells were cotransfected with plasmids expressing firefly (p5′-UTR-ATF4-FLuc) or Renilla (pRL-TK) luciferases. (A) The situation of ATF4 uORF1, uORF2 and ATF4-FLuc fusion ORF in plasmid p5′-UTR-ATF4-FLuc is represented above the graph; the hatched box correspond to the elongated uORF1. Dual luciferase assays were performed in triplicate at 24 h after transfection. The graph shows six independent transfection experiments. For each experiment, bars and error bars correspond to averages and SD of the luciferase assay triplicates. The average values (avg) and SD of the six experiments are indicated on the graph with the _P_-value (two-tailed Student’s _t_-test) and fold change of luciferase activity for sh-3a1 versus sh-Ctrl electroporated cells. (B) Stability of FLuc reporter mRNA in HCT116 cells after electroporation with shRNA targeting eRF3a mRNA (sh-3a1) or control shRNA (sh-Ctrl). Three days after electroporation, cells were treated with Actinomycin D (5 µg/ml) for various time as indicated. Total RNA was extracted and separated on a denaturing agarose gel prior northern blot analysis. The membrane was probed with LUC probe and B2M probe that served as a loading control.
Figure 4.
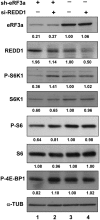
REDD1 knockdown alleviated mTOR inhibition in eRF3a-depleted cells. At 24 h after electroporation with sh-3a1 (lanes 1 and 2) or sh-Ctrl (lanes 3 and 4), HCT116 cells were transfected with either predesigned si-R9 siRNA directed against REDD1 (lanes 2 and 4) or control siRNA (lanes 1 and 3) using Lipofectamine 2000 (Invitrogen). The predisigned si-R9 siRNA allows an efficient knockdown of REDD1 (see
Supplementary Figure S4
). Western blot analysis was performed 24 h later to measure the levels of REDD1, phosphorylated S6K1 (P-S6K1), total S6K1, phosphorylated ribosomal protein S6 (P-S6), total ribosomal protein S6 (S6), phosphorylated 4E-PB1 (P-4E-BP1) and α-TUB that served as loading control. Quantification of the signals (see ‘Materials and Methods’ section) are shown below each panel. Each signal was divided by the signal elicited by the α-TUB reference protein. The control experiment (lane 3) was set to 1.
Similar articles
- Divergent effects of translation termination factor eRF3A and nonsense-mediated mRNA decay factor UPF1 on the expression of uORF carrying mRNAs and ribosome protein genes.
Aliouat A, Hatin I, Bertin P, François P, Stierlé V, Namy O, Salhi S, Jean-Jean O. Aliouat A, et al. RNA Biol. 2020 Feb;17(2):227-239. doi: 10.1080/15476286.2019.1674595. Epub 2019 Oct 17. RNA Biol. 2020. PMID: 31619139 Free PMC article. - mTORC1 Balances Cellular Amino Acid Supply with Demand for Protein Synthesis through Post-transcriptional Control of ATF4.
Park Y, Reyna-Neyra A, Philippe L, Thoreen CC. Park Y, et al. Cell Rep. 2017 May 9;19(6):1083-1090. doi: 10.1016/j.celrep.2017.04.042. Cell Rep. 2017. PMID: 28494858 Free PMC article. - The RNA Demethylases ALKBH5 and FTO Regulate the Translation of ATF4 mRNA in Sorafenib-Treated Hepatocarcinoma Cells.
Adjibade P, Di-Marco S, Gallouzi IE, Mazroui R. Adjibade P, et al. Biomolecules. 2024 Aug 1;14(8):932. doi: 10.3390/biom14080932. Biomolecules. 2024. PMID: 39199320 Free PMC article. - Does eIF3 promote reinitiation after translation of short upstream ORFs also in mammalian cells?
Hronová V, Mohammad MP, Wagner S, Pánek J, Gunišová S, Zeman J, Poncová K, Valášek LS. Hronová V, et al. RNA Biol. 2017 Dec 2;14(12):1660-1667. doi: 10.1080/15476286.2017.1353863. Epub 2017 Sep 15. RNA Biol. 2017. PMID: 28745933 Free PMC article. Review. - ATF4, an ER stress and hypoxia-inducible transcription factor and its potential role in hypoxia tolerance and tumorigenesis.
Ye J, Koumenis C. Ye J, et al. Curr Mol Med. 2009 May;9(4):411-6. doi: 10.2174/156652409788167096. Curr Mol Med. 2009. PMID: 19519398 Review.
Cited by
- Activating transcription factor 4 regulates hypoxia inducible factor 1α in chronic hypoxia in pancreatic cancer cells.
Chee NT, Carriere CH, Miller Z, Welford S, Brothers SP. Chee NT, et al. Oncol Rep. 2023 Jan;49(1):14. doi: 10.3892/or.2022.8451. Epub 2022 Nov 23. Oncol Rep. 2023. PMID: 36416348 Free PMC article. - Identification of five genes in endoplasmic reticulum (ER) stress-apoptosis pathways in yellow catfish Pelteobagrus fulvidraco and their transcriptional responses to dietary lipid levels.
Zhang DG, Cheng J, Tai ZP, Luo Z. Zhang DG, et al. Fish Physiol Biochem. 2019 Jun;45(3):1117-1127. doi: 10.1007/s10695-019-00627-4. Epub 2019 Mar 7. Fish Physiol Biochem. 2019. PMID: 30847627 - On the identification of differentially-active transcription factors from ATAC-seq data.
Gerbaldo FE, Sonder E, Fischer V, Frei S, Wang J, Gapp K, Robinson MD, Germain PL. Gerbaldo FE, et al. bioRxiv [Preprint]. 2024 Aug 20:2024.03.06.583825. doi: 10.1101/2024.03.06.583825. bioRxiv. 2024. PMID: 38496482 Free PMC article. Updated. Preprint. - Divergent effects of translation termination factor eRF3A and nonsense-mediated mRNA decay factor UPF1 on the expression of uORF carrying mRNAs and ribosome protein genes.
Aliouat A, Hatin I, Bertin P, François P, Stierlé V, Namy O, Salhi S, Jean-Jean O. Aliouat A, et al. RNA Biol. 2020 Feb;17(2):227-239. doi: 10.1080/15476286.2019.1674595. Epub 2019 Oct 17. RNA Biol. 2020. PMID: 31619139 Free PMC article. - Translation termination-dependent deadenylation of MYC mRNA in human cells.
Jolles B, Aliouat A, Stierlé V, Salhi S, Jean-Jean O. Jolles B, et al. Oncotarget. 2018 May 25;9(40):26171-26182. doi: 10.18632/oncotarget.25459. eCollection 2018 May 25. Oncotarget. 2018. PMID: 29899850 Free PMC article.
References
- Hai T, Hartman MG. The molecular biology and nomenclature of the activating transcription factor/cAMP responsive element binding family of transcription factors: activating transcription factor proteins and homeostasis. Gene. 2001;273:1–11. - PubMed
- Harding HP, Zhang Y, Zeng H, Novoa I, Lu PD, Calfon M, Sadri N, Yun C, Popko B, Paules R, et al. An integrated stress response regulates amino acid metabolism and resistance to oxidative stress. Mol. Cell. 2003;11:619–633. - PubMed
- Harding HP, Calfon M, Urano F, Novoa I, Ron D. Transcriptional and translational control in the Mammalian unfolded protein response. Annu. Rev. Cell Dev. Biol. 2002;18:575–599. - PubMed
- Kaufman RJ. Regulation of mRNA translation by protein folding in the endoplasmic reticulum. Trends Biochem. Sci. 2004;29:152–158. - PubMed
Publication types
MeSH terms
Substances
LinkOut - more resources
Full Text Sources
Miscellaneous


