PCR biases distort bacterial and archaeal community structure in pyrosequencing datasets - PubMed (original) (raw)
PCR biases distort bacterial and archaeal community structure in pyrosequencing datasets
Ameet J Pinto et al. PLoS One. 2012.
Abstract
As 16S rRNA gene targeted massively parallel sequencing has become a common tool for microbial diversity investigations, numerous advances have been made to minimize the influence of sequencing and chimeric PCR artifacts through rigorous quality control measures. However, there has been little effort towards understanding the effect of multi-template PCR biases on microbial community structure. In this study, we used three bacterial and three archaeal mock communities consisting of, respectively, 33 bacterial and 24 archaeal 16S rRNA gene sequences combined in different proportions to compare the influences of (1) sequencing depth, (2) sequencing artifacts (sequencing errors and chimeric PCR artifacts), and (3) biases in multi-template PCR, towards the interpretation of community structure in pyrosequencing datasets. We also assessed the influence of each of these three variables on α- and β-diversity metrics that rely on the number of OTUs alone (richness) and those that include both membership and the relative abundance of detected OTUs (diversity). As part of this study, we redesigned bacterial and archaeal primer sets that target the V3-V5 region of the 16S rRNA gene, along with multiplexing barcodes, to permit simultaneous sequencing of PCR products from the two domains. We conclude that the benefits of deeper sequencing efforts extend beyond greater OTU detection and result in higher precision in β-diversity analyses by reducing the variability between replicate libraries, despite the presence of more sequencing artifacts. Additionally, spurious OTUs resulting from sequencing errors have a significant impact on richness or shared-richness based α- and β-diversity metrics, whereas metrics that utilize community structure (including both richness and relative abundance of OTUs) are minimally affected by spurious OTUs. However, the greatest obstacle towards accurately evaluating community structure are the errors in estimated mean relative abundance of each detected OTU due to biases associated with multi-template PCR reactions.
Conflict of interest statement
Competing Interests: The authors have declared that no competing interests exist.
Figures
Figure 1. The mean percent GC content of the three bacterial and three archaeal mock communities (A) and the resulting reads attributed to mock community replicates in the final 454-sequencing output expressed as percent reads in sequencing library versus the GC content of the amplicon pool (B).
Error bars in panel A represent variation in GC content between replicates of each community resulting from differences in GC content of barcoded reverse primer. Black bars: bacteria, white bars: archaea. The red dotted line in panel B shows the 95% confidence band for the regression line. Black symbols: bacteria, white symbols: archaea. Diamonds (◊) and upper triangle (Δ): large library, Squares (□) and lower triangle (∇): small library.
Figure 2. The taxa detection frequency for each of the replicate mock communities at different sequencing depths are compared to detection frequency at different theoretical sampling depths.
Open circles: sub-samples of in-silico mock communities with varying number of sequences, red circles: large library, green circles: small library, solid lines: 95% confidence interval band for the in-silico sub-sampling efforts. A–C: bacteria, D–F: archaea, A/D: mock1, B/E: mock 2, C/F: mock 3. Theoretical taxa detection frequencies for mock community 1 (bacteria and archaea) are 1.0 for most in-silico sub-sampling efforts and hence are not shown in panels A and D.
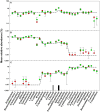
Figure 3. Relative abundance of sequences used to generate bacterial mock communities.
A: mock1, B: mock 2, C: mock 3. Dashed line: theoretical relative abundance. The experimental mean relative abundance for small libraries (green circles) and large libraries (red circles) are shown and error bars indicate standard deviations for triplicate samples. The grey box indicates a sequence that was not detected in any community; the black box indicates an OTU that consisted of two sequences at a similarity cutoff of 3%.
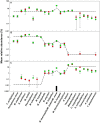
Figure 4. Relative abundance of sequences used to generate archaeal mock communities.
A: mock1, B: mock 2, C: mock 3. Dashed line: theoretical relative abundance. The experimental mean relative abundance for small libraries (green circles) and large libraries (red circles) are shown and error bars indicate standard deviations for triplicate samples. The black box indicates an OTU that consisted of two sequences at a similarity cutoff of 3%.
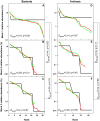
Figure 5. Rank abundance profiles for the bacterial and archaeal mock communities.
A–C: bacteria, D–F: archaea. Black lines: theoretical, green lines: small libraries, red lines: large libraries. The Kolmogorov-Smirnov statistics at the left bottom of each panel are for comparisons between large and small libraries. The Kolmogorov-Smirnov statistics to the right of each panel are for comparisons between the large libraries of m1/m2 and m1/m3.
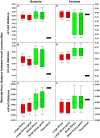
Figure 6. Diversity metrics calculated for the bacterial and archaeal mock communities.
A–D: bacteria, E–H: archaea. Black bars: theoretical, red bars: large libraries, red-hashed bars: large libraries with spurious sequences removed, green bars: small libraries, green-hashed bars: small libraries with spurious sequences removed. The error bars indicate standard deviations for triplicate samples.
Figure 7. Principal coordinate axes plot for bacterial and archaeal communities constructed using the Morisita-Horn distance (DMH).
A–C: bacteria, D–F: archaea. A/D: m1, B/E: m2, C/F: m3. Black squares indicate the theoretical mock community and the small open circles denote the in-silico sequencing efforts at sampling depths varying from 1 to 90%. The red filled squares and red open squares represent the large libraries with and without spurious OTUs, respectively, while green filled triangles and green open triangles indicate the small libraries with and without spurious OTUs, respectively. The blue circle is the centroid of the experimental libraries.
Figure 8. Comparisons of pairwise Morisita-Horn distance between bacterial and archaeal mock communities to the theoretical pairwise distances.
A–C: bacteria, D–F: archaea. A/D: m1–m2, B/E: m1–m3, C/F: m2–m3. Nine pairwise comparisons generated between three replicate libraries for each community were used to construct each box.
Similar articles
- Groundtruthing next-gen sequencing for microbial ecology-biases and errors in community structure estimates from PCR amplicon pyrosequencing.
Lee CK, Herbold CW, Polson SW, Wommack KE, Williamson SJ, McDonald IR, Cary SC. Lee CK, et al. PLoS One. 2012;7(9):e44224. doi: 10.1371/journal.pone.0044224. Epub 2012 Sep 6. PLoS One. 2012. PMID: 22970184 Free PMC article. - Reducing the effects of PCR amplification and sequencing artifacts on 16S rRNA-based studies.
Schloss PD, Gevers D, Westcott SL. Schloss PD, et al. PLoS One. 2011;6(12):e27310. doi: 10.1371/journal.pone.0027310. Epub 2011 Dec 14. PLoS One. 2011. PMID: 22194782 Free PMC article. - Nested PCR Biases in Interpreting Microbial Community Structure in 16S rRNA Gene Sequence Datasets.
Yu G, Fadrosh D, Goedert JJ, Ravel J, Goldstein AM. Yu G, et al. PLoS One. 2015 Jul 21;10(7):e0132253. doi: 10.1371/journal.pone.0132253. eCollection 2015. PLoS One. 2015. PMID: 26196512 Free PMC article. - Impact of DNA Sequencing and Analysis Methods on 16S rRNA Gene Bacterial Community Analysis of Dairy Products.
Xue Z, Kable ME, Marco ML. Xue Z, et al. mSphere. 2018 Oct 17;3(5):e00410-18. doi: 10.1128/mSphere.00410-18. mSphere. 2018. PMID: 30333179 Free PMC article. - Review and re-analysis of domain-specific 16S primers.
Baker GC, Smith JJ, Cowan DA. Baker GC, et al. J Microbiol Methods. 2003 Dec;55(3):541-55. doi: 10.1016/j.mimet.2003.08.009. J Microbiol Methods. 2003. PMID: 14607398 Review.
Cited by
- Systematic improvement of amplicon marker gene methods for increased accuracy in microbiome studies.
Gohl DM, Vangay P, Garbe J, MacLean A, Hauge A, Becker A, Gould TJ, Clayton JB, Johnson TJ, Hunter R, Knights D, Beckman KB. Gohl DM, et al. Nat Biotechnol. 2016 Sep;34(9):942-9. doi: 10.1038/nbt.3601. Epub 2016 Jul 25. Nat Biotechnol. 2016. PMID: 27454739 - Choice of molecular barcode will affect species prevalence but not bacterial community composition.
Lebret K, Schroeder J, Balestreri C, Highfield A, Cummings D, Smyth T, Schroeder D. Lebret K, et al. Mar Genomics. 2016 Oct;29:39-43. doi: 10.1016/j.margen.2016.09.001. Epub 2016 Sep 16. Mar Genomics. 2016. PMID: 27650378 Free PMC article. - Effects of error, chimera, bias, and GC content on the accuracy of amplicon sequencing.
Qin Y, Wu L, Zhang Q, Wen C, Van Nostrand JD, Ning D, Raskin L, Pinto A, Zhou J. Qin Y, et al. mSystems. 2023 Dec 21;8(6):e0102523. doi: 10.1128/msystems.01025-23. Epub 2023 Dec 1. mSystems. 2023. PMID: 38038441 Free PMC article. - Metagenomics insights into food fermentations.
De Filippis F, Parente E, Ercolini D. De Filippis F, et al. Microb Biotechnol. 2017 Jan;10(1):91-102. doi: 10.1111/1751-7915.12421. Epub 2016 Oct 6. Microb Biotechnol. 2017. PMID: 27709807 Free PMC article. Review. - Toward Personalized Oral Diagnosis: Distinct Microbiome Clusters in Periodontitis Biofilms.
Wirth R, Pap B, Maróti G, Vályi P, Komlósi L, Barta N, Strang O, Minárovits J, Kovács KL. Wirth R, et al. Front Cell Infect Microbiol. 2021 Dec 22;11:747814. doi: 10.3389/fcimb.2021.747814. eCollection 2021. Front Cell Infect Microbiol. 2021. PMID: 35004342 Free PMC article.
References
- Metzker ML (2010) Sequencing technologies-the next generation. Nat Rev Genet 11: 31–46. - PubMed
- Galand PE, Casamayor EO, Kirchman DL, Potvin M, Lovejoy C (2009) Unique archaeal assemblages in the Arctic Ocean unveiled by massively parallel tag sequencing. ISME J 3: 860–869. - PubMed
- Hollister EB, Engledow AS, Hammett AJM, Provin TL, Wilkinson HH, et al. (2010) Shifts in microbial community structure along an ecological gradient of hypersaline soils and sediments. ISME J 4: 829–838. - PubMed
Publication types
MeSH terms
Substances
Grants and funding
This research was partially supported by United States National Science Foundation grants BES-0412618, CBET-0967707, and CBET-1133793, and Water Research Foundation Tailored Collaboration project no. 4346. No additional external funding received for this study. The funders had no role in study design, data collection and analysis, decision to publish, or preparation of the manuscript.
LinkOut - more resources
Full Text Sources
Other Literature Sources
Molecular Biology Databases
Research Materials


