Research resource: RNA-Seq reveals unique features of the pancreatic β-cell transcriptome - PubMed (original) (raw)
Research resource: RNA-Seq reveals unique features of the pancreatic β-cell transcriptome
Gregory M Ku et al. Mol Endocrinol. 2012 Oct.
Abstract
The pancreatic β-cell is critical for the maintenance of glycemic control. Knowing the compendium of genes expressed in β-cells will further our understanding of this critical cell type and may allow the identification of future antidiabetes drug targets. Here, we report the use of next-generation sequencing to obtain nearly 1 billion reads from the polyadenylated RNA of islets and purified β-cells from mice. These data reveal novel examples of β-cell-specific splicing events, promoter usage, and over 1000 long intergenic noncoding RNA expressed in mouse β-cells. Many of these long intergenic noncoding RNA are β-cell specific, and we hypothesize that this large set of novel RNA may play important roles in β-cell function. Our data demonstrate unique features of the β-cell transcriptome.
Figures
Fig. 1.
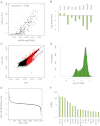
mRNA-seq of mouse islets and primary mouse β-cells demonstrates β-cell-specific genes. A, A comparison of RT-qPCR quantification (y-axis) and mRNA-seq quantification (x-axis) of GPCR expression. Each point represents a single GPCR gene. RT-qPCR data were plotted with permission (16). B, Log base 2-fold change in normalized read counts from β-cells vs. islets for the indicated genes. All were statistically significant with q value < 1 × 10⁻¹⁴. C, Identification of RefSeq genes enriched and depleted in β-cells. FPKM in β-cells (y-axis) is plotted _vs._ the FPKM in islets (x-axis). _Red dots_ indicate a q value < 0.1. _Black dots_ indicate q value > 0.1. The blue dashed oval is highly enriched for exocrine secreted enzymes (see text). D, Histogram of FPKM levels of RefSeq genes expressed in β-cells. E, Log base 10 ratio of β-cell FPKM to the average FPKM of all non-β tissues is plotted (β-cell specificity score) for β-cell-expressed genes. Green circles indicate genes statistically significantly increased in β-cells over all five non-β-cell tissues (q value < 0.1). F, FPKM values of the 16 genes with no detectable expression in any of the other five non-β-cell tissues examined. AU, Arbitrary units.
Fig. 2.
mRNA-seq identifies the β-cell Tph1 promoter. A, The short form of Tph1 is the dominant isoform expressed in β-cells. mRNA-seq reads from β-cells (top) are plotted with the exon structure of RefSeq transcripts for Tph1 locus (bottom). On the left is a heat map of expression level of each transcript in β-cells and skeletal muscle. B, RT-PCR with primers to the indicated exons was performed and run on an agarose gel. C, RT-qPCR targeting the indicated exons from islets isolated from pregnant (preg) and nonpregnant (non-preg) mice. Fold induction over nonpregnant levels is plotted with
se
(n = 2 mice from each condition). *, P value < 0.01 between pregnant and nonpregnant mice. D, The upstream region of exon 1b is sufficient to drive transcription in β-cells. The indicated constructs were transfected into MIN6 cells, and luciferase activity was determined. The
se
is plotted (n = 4). *, P < 0.0001 vs. no-promoter control.
Fig. 3.
Examples of β-cell-specific splicing events and alternative promoter use. A, Vps8: heat map showing expression of three major isoforms of Vps8 (left) and their transcript structures (bottom right). mRNA-seq reads mapping to the locus are shown for β-cell, liver, lung fibroblast (fibro), and neural progenitor cell (NPC) (top). The green box highlights a β-cell-specific exon 1 that is not present in other tissues. B, Rasgrf1: as in A, but Rasgrf1 is expressed only in brain and β-cells, so only these two tissues are listed. The green box highlights a β-cell-specific exon 2.
Fig. 4.
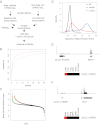
Identification of β-cell lincRNA. A, Filtering strategy for lincRNA identification (see text for details). B, Cumulative distribution plot of FPKM of lincRNA (red) and protein-coding (green) genes shows that most lincRNA are expressed at lower levels vs. protein-coding genes. C, β-Cell enrichment score (log base 10 ratio of β-cell FPKM over average non-β-cell FPKM) for lincRNA (black and red) and protein-coding genes (black and green). Colored circles indicate genes for which there is a statistically significant increase in β-cells over all six non-β-cell tissues examined. D, Histogram of maximum PhyloP score (placental mammals) of lincRNA (red), protein-coding genes (NM, blue), and repeat masked sequence (RPMSK, black) showing that most protein-coding genes show high conservation, whereas only a minority of lincRNA show equivalent conservation. E, mRNA-seq reads and predicted transcript structure of a novel potential lincRNA 5′ of the Nkx6-1 locus. F, mRNA-seq reads and predicted transcript structure of lying antisense to the Pdx1 locus. NPC, Neural progenitor cell; sk muscl, skeletal muscle.
Similar articles
- Androgen receptor-deficient islet β-cells exhibit alteration in genetic markers of insulin secretion and inflammation. A transcriptome analysis in the male mouse.
Xu W, Niu T, Xu B, Navarro G, Schipma MJ, Mauvais-Jarvis F. Xu W, et al. J Diabetes Complications. 2017 May;31(5):787-795. doi: 10.1016/j.jdiacomp.2017.03.002. Epub 2017 Mar 9. J Diabetes Complications. 2017. PMID: 28343791 Free PMC article. - Comparative transcriptome analysis of epithelial and fiber cells in newborn mouse lenses with RNA sequencing.
Hoang TV, Kumar PK, Sutharzan S, Tsonis PA, Liang C, Robinson ML. Hoang TV, et al. Mol Vis. 2014 Nov 4;20:1491-517. eCollection 2014. Mol Vis. 2014. PMID: 25489224 Free PMC article. - Integrative transcriptome sequencing identifies trans-splicing events with important roles in human embryonic stem cell pluripotency.
Wu CS, Yu CY, Chuang CY, Hsiao M, Kao CF, Kuo HC, Chuang TJ. Wu CS, et al. Genome Res. 2014 Jan;24(1):25-36. doi: 10.1101/gr.159483.113. Epub 2013 Oct 16. Genome Res. 2014. PMID: 24131564 Free PMC article. - The pancreatic β-cell transcriptome and integrated-omics.
Blodgett DM, Cura AJ, Harlan DM. Blodgett DM, et al. Curr Opin Endocrinol Diabetes Obes. 2014 Apr;21(2):83-8. doi: 10.1097/MED.0000000000000051. Curr Opin Endocrinol Diabetes Obes. 2014. PMID: 24526012 Free PMC article. Review. - Current and Future Methods for mRNA Analysis: A Drive Toward Single Molecule Sequencing.
Bayega A, Fahiminiya S, Oikonomopoulos S, Ragoussis J. Bayega A, et al. Methods Mol Biol. 2018;1783:209-241. doi: 10.1007/978-1-4939-7834-2_11. Methods Mol Biol. 2018. PMID: 29767365 Review.
Cited by
- Long noncoding RNAs in diseases of aging.
Kim J, Kim KM, Noh JH, Yoon JH, Abdelmohsen K, Gorospe M. Kim J, et al. Biochim Biophys Acta. 2016 Jan;1859(1):209-21. doi: 10.1016/j.bbagrm.2015.06.013. Epub 2015 Jul 2. Biochim Biophys Acta. 2016. PMID: 26141605 Free PMC article. Review. - Transcriptomic profiling of pancreatic alpha, beta and delta cell populations identifies delta cells as a principal target for ghrelin in mouse islets.
Adriaenssens AE, Svendsen B, Lam BY, Yeo GS, Holst JJ, Reimann F, Gribble FM. Adriaenssens AE, et al. Diabetologia. 2016 Oct;59(10):2156-65. doi: 10.1007/s00125-016-4033-1. Epub 2016 Jul 7. Diabetologia. 2016. PMID: 27390011 Free PMC article. - Epigenetic modifications and long noncoding RNAs influence pancreas development and function.
Arnes L, Sussel L. Arnes L, et al. Trends Genet. 2015 Jun;31(6):290-9. doi: 10.1016/j.tig.2015.02.008. Epub 2015 Mar 23. Trends Genet. 2015. PMID: 25812926 Free PMC article. Review. - Decreased 11β-Hydroxysteroid Dehydrogenase 1 Level and Activity in Murine Pancreatic Islets Caused by Insulin-Like Growth Factor I Overexpression.
Chowdhury S, Grimm L, Gong YJ, Wang B, Li B, Srikant CB, Gao ZH, Liu JL. Chowdhury S, et al. PLoS One. 2015 Aug 25;10(8):e0136656. doi: 10.1371/journal.pone.0136656. eCollection 2015. PLoS One. 2015. PMID: 26305481 Free PMC article. - Characterization of the G protein-coupled receptor family SREB across fish evolution.
Breton TS, Sampson WGB, Clifford B, Phaneuf AM, Smidt I, True T, Wilcox AR, Lipscomb T, Murray C, DiMaggio MA. Breton TS, et al. Sci Rep. 2021 Jun 8;11(1):12066. doi: 10.1038/s41598-021-91590-9. Sci Rep. 2021. PMID: 34103644 Free PMC article.
References
- Mortazavi A, Williams BA, McCue K, Schaeffer L, Wold B. 2008. Mapping and quantifying mammalian transcriptomes by RNA-Seq. Nat Methods 5:621–628 - PubMed
Publication types
MeSH terms
Substances
Grants and funding
- P30 DK063720/DK/NIDDK NIH HHS/United States
- T32 DK007418/DK/NIDDK NIH HHS/United States
- R01 DK021344/DK/NIDDK NIH HHS/United States
- RC1DK086290/DK/NIDDK NIH HHS/United States
- K08DK087945/DK/NIDDK NIH HHS/United States
- P30DK063720/DK/NIDDK NIH HHS/United States
- K08 DK087945/DK/NIDDK NIH HHS/United States
- RC1 DK086290/DK/NIDDK NIH HHS/United States
- U01DK08954/DK/NIDDK NIH HHS/United States
- R01DK021344/DK/NIDDK NIH HHS/United States


