Giant viruses coexisted with the cellular ancestors and represent a distinct supergroup along with superkingdoms Archaea, Bacteria and Eukarya - PubMed (original) (raw)
Giant viruses coexisted with the cellular ancestors and represent a distinct supergroup along with superkingdoms Archaea, Bacteria and Eukarya
Arshan Nasir et al. BMC Evol Biol. 2012.
Abstract
Background: The discovery of giant viruses with genome and physical size comparable to cellular organisms, remnants of protein translation machinery and virus-specific parasites (virophages) have raised intriguing questions about their origin. Evidence advocates for their inclusion into global phylogenomic studies and their consideration as a distinct and ancient form of life.
Results: Here we reconstruct phylogenies describing the evolution of proteomes and protein domain structures of cellular organisms and double-stranded DNA viruses with medium-to-very-large proteomes (giant viruses). Trees of proteomes define viruses as a 'fourth supergroup' along with superkingdoms Archaea, Bacteria, and Eukarya. Trees of domains indicate they have evolved via massive and primordial reductive evolutionary processes. The distribution of domain structures suggests giant viruses harbor a significant number of protein domains including those with no cellular representation. The genomic and structural diversity embedded in the viral proteomes is comparable to the cellular proteomes of organisms with parasitic lifestyles. Since viral domains are widespread among cellular species, we propose that viruses mediate gene transfer between cells and crucially enhance biodiversity.
Conclusions: Results call for a change in the way viruses are perceived. They likely represent a distinct form of life that either predated or coexisted with the last universal common ancestor (LUCA) and constitute a very crucial part of our planet's biosphere.
Figures
Figure 1
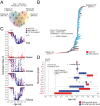
History of protein domain structures. A. The Venn diagram shows distribution of FSFs in the taxonomic groups. Viral families included in the analysis: Adenoviridae, Ascoviridae, Asfarviridae, Corticoviridae, Iridoviridae, Marseilleviridae, Mimiviridae, Phycodnaviridae, Poxviridae, Rudiviridae, and Tectiviridae (see Table 2). B. Phylogenomic tree of protein domain structure describing the evolution of 1,739 FSFs in 1,037 proteomes (4,63,915 steps; consistency index CI = 0.051; retention index RI = 0.795; tree skewness _g_1 = −0.127). Taxa are FSFs and characters are proteomes. Terminal leaves were not labeled, as they would not be legible. C. Distribution index (f, the number of species using an FSF/total number of species) of each FSF plotted against relative age (nd, number of nodes from the root/total number of nodes) for the four supergroups and individually for sampled viruses, Archaea, Bacteria, and Eukarya. D. Boxplots displaying distribution of FSFs in viral and cellular taxonomic groups with respect to age (nd). Vertical lines within each distribution represent group median values. Dotted vertical lines represent important evolutionary events in the evolution of proteomes.
Figure 2
Evolution of the major domains of aminoacyl-tRNA synthetase (aaRS) enzymes. A. The leucyl-tRNA synthetase (LeuRS) enzyme in complex with tRNALeu (PDB entry 1WZ2) with its three domains (catalytic, editing and anticodon-binding) colored according to their age of origin. Domain ages were derived from a ToD at FF level of structural complexity [41]. Note how the variable arm of tRNA makes crucial contact with the anticodon-binding domain, which is evolutionarily derived, while the acceptor arm contacts the ancient catalytic domain in pre-editing conformation. B. Occurrence (box plots) and abundance (pie charts) of 28 fold family (FF) domains of aaRS enzymes with known structures in the total genomic dataset of 1,037 cellular organisms and viruses. The name and function of domains are described in Table S2 of the Additional file. C. Phylogenomic tree of protein domain structures describing the evolution of the 28 FFs of aaRSs in the 1,037 proteomes (982 parsimony informative characters; 26,638 steps; CI = 0.8479; RI = 0.8742; _g_1 = −0.1.401). Taxa are aaRS FF domains and characters are proteomes. FFs are labeled with SCOP concise classification strings. Numbers on the branches indicate bootstrap values. FF domains present in viruses are highlighted in red. Note that d.104.1.1 has been identified in megavirus (not included in this study).
Figure 3
Universal tree of life (uToL) and proteomic diversity. A. One optimal most parsimonious phylogenomic tree describing the evolution of 200 proteomes (50 each from Archaea, Bacteria, and Eukarya and viruses; virus families are listed in Table 2) generated using the census of abundance of 1,739 FSFs (1,517 parsimoniously informative sites; 62,061 steps; CI = 0.156; RI = 0.804; _g_1 = −0.325). Terminal leaves of viruses (V), Archaea (A), Eukarya (E) and Bacteria (B) were labeled in red, blue, black and green respectively Numbers on the branches indicate bootstrap values. B. FSF diversity (number of distinct FSFs in a proteome) plotted against FSF abundance (total number of FSFs that are encoded) for 200 proteomes. Major families/phyla/kingdoms are labeled. Both axes are in logarithmic scale.
Figure 4
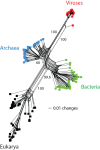
Network tree visualization of the supergroups. Network tree generated from the presence/absence matrix of 1,739 FSFs in 200 proteomes sampled equally from the four supergroups. The number of non-constant sites was 1,581. Nodes in the network tree are proteomes and are represented by rectangles labelled red, blue, green, and black for viruses, Archaea, Bacteria and Eukarya, respectively. Numbers on the major splits indicate bootstrap values.
Figure 5
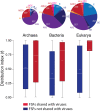
Enrichment of viral FSFs. Boxplots comparing the distribution index (f) of FSFs shared or not shared with viruses for each cellular superkingdom. Pie charts above each superkingdom represent distribution of FSFs in taxonomical groups within each superkingdom.
Figure 6
Functional distribution of viral FSFs in major functional categories. Histogram comparing the number of viral FSFs corresponding to major functional categories plotted against nd. The distribution of functions that appeared early and late is significantly biased. Numbers on top of individual bars indicate total number of FSFs corresponding to each functional category.
Figure 7
Functional distribution of viral FSFs in minor functional categories. Histograms comparing the number of viral FSFs corresponding to each of the minor categories within each major functional category.
Similar articles
- The evolutionary history of protein fold families and proteomes confirms that the archaeal ancestor is more ancient than the ancestors of other superkingdoms.
Kim KM, Caetano-Anollés G. Kim KM, et al. BMC Evol Biol. 2012 Jan 27;12:13. doi: 10.1186/1471-2148-12-13. BMC Evol Biol. 2012. PMID: 22284070 Free PMC article. - Untangling the origin of viruses and their impact on cellular evolution.
Nasir A, Sun FJ, Kim KM, Caetano-Anollés G. Nasir A, et al. Ann N Y Acad Sci. 2015 Apr;1341:61-74. doi: 10.1111/nyas.12735. Epub 2015 Mar 10. Ann N Y Acad Sci. 2015. PMID: 25758413 Review. - Evolution of the Large Nucleocytoplasmic DNA Viruses of Eukaryotes and Convergent Origins of Viral Gigantism.
Koonin EV, Yutin N. Koonin EV, et al. Adv Virus Res. 2019;103:167-202. doi: 10.1016/bs.aivir.2018.09.002. Epub 2018 Nov 10. Adv Virus Res. 2019. PMID: 30635076 Review. - The origin and evolution of viruses inferred from fold family structure.
Mughal F, Nasir A, Caetano-Anollés G. Mughal F, et al. Arch Virol. 2020 Oct;165(10):2177-2191. doi: 10.1007/s00705-020-04724-1. Epub 2020 Aug 3. Arch Virol. 2020. PMID: 32748179 Free PMC article. Review. - Did Viruses Evolve As a Distinct Supergroup from Common Ancestors of Cells?
Harish A, Abroi A, Gough J, Kurland C. Harish A, et al. Genome Biol Evol. 2016 Aug 27;8(8):2474-81. doi: 10.1093/gbe/evw175. Genome Biol Evol. 2016. PMID: 27497315 Free PMC article.
Cited by
- Translation in giant viruses: a unique mixture of bacterial and eukaryotic termination schemes.
Jeudy S, Abergel C, Claverie JM, Legendre M. Jeudy S, et al. PLoS Genet. 2012;8(12):e1003122. doi: 10.1371/journal.pgen.1003122. Epub 2012 Dec 13. PLoS Genet. 2012. PMID: 23271980 Free PMC article. - MANET 3.0: Hierarchy and modularity in evolving metabolic networks.
Mughal F, Caetano-Anollés G. Mughal F, et al. PLoS One. 2019 Oct 24;14(10):e0224201. doi: 10.1371/journal.pone.0224201. eCollection 2019. PLoS One. 2019. PMID: 31648227 Free PMC article. - Diversity and Distribution Characteristics of Viruses from Soda Lakes.
ZeinEldin RA, Ahmed MM, Hassanein WS, Elshafey N, Sofy AR, Hamedo HA, Elnosary ME. ZeinEldin RA, et al. Genes (Basel). 2023 Jan 26;14(2):323. doi: 10.3390/genes14020323. Genes (Basel). 2023. PMID: 36833250 Free PMC article. - Genome segregation and packaging machinery in Acanthamoeba polyphaga mimivirus is reminiscent of bacterial apparatus.
Chelikani V, Ranjan T, Zade A, Shukla A, Kondabagil K. Chelikani V, et al. J Virol. 2014 Jun;88(11):6069-75. doi: 10.1128/JVI.03199-13. Epub 2014 Mar 12. J Virol. 2014. PMID: 24623441 Free PMC article. - Mimiviridae: clusters of orthologous genes, reconstruction of gene repertoire evolution and proposed expansion of the giant virus family.
Yutin N, Colson P, Raoult D, Koonin EV. Yutin N, et al. Virol J. 2013 Apr 4;10:106. doi: 10.1186/1743-422X-10-106. Virol J. 2013. PMID: 23557328 Free PMC article.
References
Publication types
MeSH terms
Substances
LinkOut - more resources
Full Text Sources
Miscellaneous


