TrxG and PcG proteins but not methylated histones remain associated with DNA through replication - PubMed (original) (raw)
TrxG and PcG proteins but not methylated histones remain associated with DNA through replication
Svetlana Petruk et al. Cell. 2012.
Abstract
Propagation of gene-expression patterns through the cell cycle requires the existence of an epigenetic mark that re-establishes the chromatin architecture of the parental cell in the daughter cells. We devised assays to determine which potential epigenetic marks associate with epigenetic maintenance elements during DNA replication in Drosophila embryos. Histone H3 trimethylated at lysines 4 or 27 is present during transcription but, surprisingly, is replaced by nonmethylated H3 following DNA replication. Methylated H3 is detected on DNA only in nuclei not in S phase. In contrast, the TrxG and PcG proteins Trithorax and Enhancer-of-Zeste, which are H3K4 and H3K27 methylases, and Polycomb continuously associate with their response elements on the newly replicated DNA. We suggest that histone modification enzymes may re-establish the histone code on newly assembled unmethylated histones and thus may act as epigenetic marks.
Copyright © 2012 Elsevier Inc. All rights reserved.
Figures
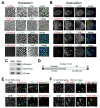
Figure 1. Methylated histones are weakly associated with replicating nuclei
(A, B) Double-immunostaining of Drosophila embryos was performed with indicated antibodies against PCNA (green) and H4K5Ac, H3K4me3, H3K27me3 and antibody to unmodified N-terminus (aa 1–20) of histone H3. Nuclei were stained with DAPI. (A) cellular blastoderm, (B) early gastrulating Drosophila embryos. See also Figure S1. (C) Quantification of H3K4me3 and H3K27me3 in the cellular blastoderm and gastrulating embryos by Western blotting. (D) Schematic diagram showing the length of the cell cycle phases in mid-staged Drosophila embryos (adopted from (Shermoen et al., 2010). (E) Gastrulating embryos were labeled with EdU for 10 min and immunostained for EdU (green) and for H3K4me3 or H3K27me3 (red). Red arrows indicate early replicating nuclei, and green arrows indicate late replicating nuclei as described in (Shermoen et al., 2010). (F) Gastrulating embryos were pulse labeled with EdU for 10 min and kept for 120 min prior to fixation. Embryos were immunostained for EdU (green) and for H3K4me3 or H3K27me3 (red).
Figure 2. Trx, Pc and E(z) transiently interact with PCNA
(A) Top panel, PLA signals between PCNA antibody and antibodies indicated on the top. Bottom, DAPI staining on the same embryos. Photos are taken at 20X magnification. See also Figure S1. (B) 100X magnification of the embryos from the same experiments. PLA signals are in red, EdU is in green. DAPI is shown at the bottom.
Figure 3. The size and composition of the replicating DNA fragments
(A) Schematic diagram showing location of parental dsDNA (two black lines), parental ssDNA (one black line), and replicated nascent DNA (one red and one black line) and the replication fork (RF). The direction of travel of the RF, and of the DNA polymerase complexes on the leading and lagging strands (PCNA is indicated as a torus, and the polymerase as a tear drop) are indicated. (B) Map of the bxd ME region tested. The primer sets are indicated below the map. Fixed primers in the center are boxed in red. (C) The relative efficiency of primer sets on genomic DNA. The raw data in D,E,G were normalized by multiplying the reciprocal of the efficiencies of amplification for each primer pair relative to primer pair 6. Data are represented as mean +/− SEM. (D) The relative abundance of sonicated DNA amplified in PCR using the primer sets in shown in B. Data are represented as mean +/− SEM. (E) The relative abundance of DNA fragments immunoprecipitated with PCNA following sonication that amplifies in PCR reactions. Below the graph is shown the percentage of the population of amplified fragments, determined after correcting for overlap. Data are represented as mean +/− SEM. (F) Carrier ssDNA (0.5 μg) was digested with 0, 1.5 and 15 units of S1 nuclease, to determine the titer necessary for complete digestion. Data are represented as mean +/− SEM. (G) The relative abundance of DNA immunoprecipitated with PCNA and digested with 0, 1.5, and 15 units of S1 nuclease. 0.5 μg of carrier ssDNA was added to each reaction. The experiments were performed at least three times. Data are represented as mean +/− SEM..
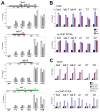
Figure 4. Methylated histones H3 are replaced by unmodified histone H3 on nascent DNA
(A) ChIP assays from chromatin prepared from 2–15 h AEL embryos. Antibodies are indicated at the bottom. Locations of the primer sets within four tested TRE/PRE sequences are shown in the schemes on the top of each graph. Mapped TRE and PRE sequences in the bxd region are shown in black (Tillib et al., 1999). Known DNase I hypersensitive sites in the bxd (Dellino et al., 2002) and iab-7 (Mishra et al., 2001) elements of the BX-C are shown in red. Mapped pairing sensitive regions in the en PRE are shown in green (Kassis, 1994). Primer sets in the iab-9 PRE are chosen based on data from (Beisel et al., 2007). The central primer sets (shown in red on the maps and as dark grey bars in the graphs) were used in all experiments in this and subsequent figures. Data are represented as mean +/− SEM. (B) Top, ChIP assays with IgG (black), H3 (purple) and H2B (maroon) antibodies from chromatin prepared from 2–15 h AEL embryos. Bottom, sequential re-ChIP assays using chromatin prepared from 2–15 h AEL embryos. Chromatin was immunoprecipitated with PCNA antibody, eluted and precipitated with IgG, H3 and H2B antibodies. Percent of input for re-ChIP experiments was calculated using as a standard the material eluted from the beads following immunoprecipitation with PCNA. See also Figure S3. Coordinates of the primer sets to four MEs, bxd, iab-7, iab-9, en and two non-ME regions, C1 and C2, are given in Extended Experimental Procedures. All ChIP and re-ChIP experiments in this paper were done at least in triplicate, and standard error bars are shown in these and subsequent figures. Data are represented as mean +/− SEM. (C) Top, ChIP assays with IgG (black), and antibodies to unmodified N-terminus of H3 (purple), H3K4me3 (maroon), H3K27me3 (light yellow) and H4K5Ac (magenta) were performed on bulk chromatin prepared from 2–15 h AEL embryos at 6 loci. Bottom, sequential re-ChIP assays using PCNA in the first immunoprecipitation step, using the same antibodies as in ChIP in the second immunoprecipitation step. The same regions as in Figure 2 were tested in A and B. See also Figure S4. Data are represented as mean +/− SEM.
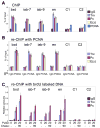
Figure 5. Trx, Pc and E(z) are specifically associated with their MEs on nascent DNA from embryos
(A) ChIP assays with IgG (black), Trx (purple), Pc (maroon), E(z) (light yellow) and PCNA (blue) antibodies from chromatin prepared from 2–15 h AEL embryos. The central primer sets shown in Figure 4A were used. Data are represented as mean +/− SEM. (B) Sequential re-ChIP assays using either IgG or PCNA antibodies (indicated at the bottom) in the first immunoprecipitation step, and Trx, Pc and E(z) antibodies in the second immunoprecipitation step. Percent of input for re-ChIP experiments was calculated using the amount of material eluted from the beads following immunoprecipitation with PCNA as 100% input. Data are represented as mean +/− SEM. (C) Sequential re-ChIP assays using chromatin prepared from 2–7 h AEL embryos that were labeled with brdU for 20 min and for 20 min followed by a pulse of 1.5 h. Chromatin was first immunoprecipitated with Trx Pc or IgG antibodies. In the second step, DNA purified from the resulting material was immunoprecipitated with the brdU antibody. Chromatin from unlabeled embryos was used as a control. Since multiple samples from the first step are shown on the same graph, relative amounts are shown instead of the percent of input which is specific for each sample. The percentages of input for brdU immunoprecipitation from the Pc and Trx samples in different regions range from 1 to 4%, respectively. Calculations used DNA purified from the material following immunoprecipitation with Trx and Pc antibodies as 100% input. Data are represented as mean +/− SEM.
Figure 6. Chromatin assembly on nascent DNA
(A) Schematic representation of the CAA. Incorporated EdU and conjugated biotin are shown as red and purple circles on nascent DNA, respectively. The assembled proteins are shown as squares. Amplified PLA signal is shown in red. (B) PLA signals between EdU and H4K5Ac (red). The same embryo is immunostained for EdU (green) after the PLA reaction to identify replicating nuclei. The magnified merged image of the part of this embryo is on the right. (C) PLA signals in red resulting from CAA between EdU and the histone proteins indicated on the top. Gastrulating embryos were labeled with EdU for 5 min. In C–E, following the PLA reaction embryos were immunostained for EdU (green). (D) Pulse-chase CAA for H4K5Ac and unmodified H3 tail. Gastrulating embryos were pulse labeled with EdU for 10 min, washed extensively to remove EdU and kept for 0, 30 and 60 min prior to fixation. PLA signals in red between EdU and the proteins indicated to the left. (E) Pulse-chase CAA for methylated H3 forms (shown on the left). Experiments were performed as in D. (F) 2 hr pulse-chase CAA for methylated H3 forms. Following PLA reaction embryos were immunostained for PCNA (green) to distinguish replicating nuclei.
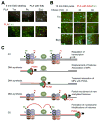
Figure 7. Trx, Pc and E(z) are associated with nascent DNA throughout S phase
(A) PLA signals in red resulting from CAA between EdU and Trx, Pc and E(z). Gastrulating embryos were labeled with EdU for 5 min. Following the PLA reaction embryos were immunostained for EdU (green). Only red channel is shown on the top. (B) Pulse-chase CAA for Trx, Pc and E(z). Gastrulating embryos were pulse labeled with EdU for 10 min, washed extensively to remove EdU and kept for 0, 30 and 60 min prior to fixation. PLA signals in red between EdU and the proteins indicated to the left. Following the PLA reaction, embryos were immunostained for EdU (green). (E) A model for the re-constitution of chromatin structure during DNA replication. MP, maintenance proteins (TrxG and PcG); RF, replication fork. Note that full nucleosomes may not be assembled immediately after passage of DNA polymerase.
Comment in
- Holding on through DNA replication: histone modification or modifier?
Abmayr SM, Workman JL. Abmayr SM, et al. Cell. 2012 Aug 31;150(5):875-7. doi: 10.1016/j.cell.2012.08.006. Cell. 2012. PMID: 22939615
Similar articles
- Functional conservation of Asxl2, a murine homolog for the Drosophila enhancer of trithorax and polycomb group gene Asx.
Baskind HA, Na L, Ma Q, Patel MP, Geenen DL, Wang QT. Baskind HA, et al. PLoS One. 2009;4(3):e4750. doi: 10.1371/journal.pone.0004750. Epub 2009 Mar 9. PLoS One. 2009. PMID: 19270745 Free PMC article. - Trithorax monomethylates histone H3K4 and interacts directly with CBP to promote H3K27 acetylation and antagonize Polycomb silencing.
Tie F, Banerjee R, Saiakhova AR, Howard B, Monteith KE, Scacheri PC, Cosgrove MS, Harte PJ. Tie F, et al. Development. 2014 Mar;141(5):1129-39. doi: 10.1242/dev.102392. Development. 2014. PMID: 24550119 Free PMC article. - Association of trxG and PcG proteins with the bxd maintenance element depends on transcriptional activity.
Petruk S, Smith ST, Sedkov Y, Mazo A. Petruk S, et al. Development. 2008 Aug;135(14):2383-90. doi: 10.1242/dev.023275. Epub 2008 Jun 11. Development. 2008. PMID: 18550707 - From genetics to epigenetics: the tale of Polycomb group and trithorax group genes.
Grimaud C, Nègre N, Cavalli G. Grimaud C, et al. Chromosome Res. 2006;14(4):363-75. doi: 10.1007/s10577-006-1069-y. Chromosome Res. 2006. PMID: 16821133 Review. - Extra sex combs, chromatin, and cancer: exploring epigenetic regulation and tumorigenesis in Drosophila.
Zhang C, Liu B, Li G, Zhou L. Zhang C, et al. J Genet Genomics. 2011 Oct 20;38(10):453-60. doi: 10.1016/j.jgg.2011.09.007. Epub 2011 Sep 24. J Genet Genomics. 2011. PMID: 22035866 Free PMC article. Review.
Cited by
- Detection of RNA-DNA association by a proximity ligation-based method.
Petruk S, Fenstermaker TK, Black KL, Brock HW, Mazo A. Petruk S, et al. Sci Rep. 2016 Jun 3;6:27313. doi: 10.1038/srep27313. Sci Rep. 2016. PMID: 27256324 Free PMC article. - Epigenome Maintenance in Response to DNA Damage.
Dabin J, Fortuny A, Polo SE. Dabin J, et al. Mol Cell. 2016 Jun 2;62(5):712-27. doi: 10.1016/j.molcel.2016.04.006. Mol Cell. 2016. PMID: 27259203 Free PMC article. Review. - How the cell cycle impacts chromatin architecture and influences cell fate.
Ma Y, Kanakousaki K, Buttitta L. Ma Y, et al. Front Genet. 2015 Feb 3;6:19. doi: 10.3389/fgene.2015.00019. eCollection 2015. Front Genet. 2015. PMID: 25691891 Free PMC article. - Replicating Nucleosomes.
Ramachandran S, Henikoff S. Ramachandran S, et al. Sci Adv. 2015 Aug 7;1(7):e1500587. doi: 10.1126/sciadv.1500587. Sci Adv. 2015. PMID: 26269799 Free PMC article. - A polycomb group protein is retained at specific sites on chromatin in mitosis.
Follmer NE, Wani AH, Francis NJ. Follmer NE, et al. PLoS Genet. 2012;8(12):e1003135. doi: 10.1371/journal.pgen.1003135. Epub 2012 Dec 20. PLoS Genet. 2012. PMID: 23284300 Free PMC article.
References
- Brown DD. The role of stable complexes that repress and activate eukaryotic genes. Philos Trans R Soc Lond B Biol Sci. 1984;307:297–299. - PubMed
- Cao R, Wang L, Wang H, Xia L, Erdjument-Bromage H, Tempst P, Jones RS, Zhang Y. Role of histone H3 lysine 27 methylation in Polycomb-group silencing. Science. 2002;298:1039–1043. - PubMed
- Cavalli G, Paro R. The Drosophila Fab-7 chromosomal element conveys epigenetic inheritance during mitosis and meiosis. Cell. 1998;93:505–518. - PubMed
Publication types
MeSH terms
Substances
Grants and funding
- P01CA129242/CA/NCI NIH HHS/United States
- CAPMC/ CIHR/Canada
- R01GM075141/GM/NIGMS NIH HHS/United States
- R01 GM075141/GM/NIGMS NIH HHS/United States
- P01 CA050507/CA/NCI NIH HHS/United States
- P01 CA129242/CA/NCI NIH HHS/United States
LinkOut - more resources
Full Text Sources
Other Literature Sources
Molecular Biology Databases


