Chemokine-dependent T cell migration requires aquaporin-3-mediated hydrogen peroxide uptake - PubMed (original) (raw)
Chemokine-dependent T cell migration requires aquaporin-3-mediated hydrogen peroxide uptake
Mariko Hara-Chikuma et al. J Exp Med. 2012.
Abstract
Chemokine-dependent trafficking is indispensable for the effector function of antigen-experienced T cells during immune responses. In this study, we report that the water/glycerol channel aquaporin-3 (AQP3) is expressed on T cells and regulates their trafficking in cutaneous immune reactions. T cell migration toward chemokines is dependent on AQP3-mediated hydrogen peroxide (H(2)O(2)) uptake but not the canonical water/glycerol transport. AQP3-mediated H(2)O(2) transport is essential for the activation of the Rho family GTPase Cdc42 and the subsequent actin dynamics. Coincidentally, AQP3-deficient mice are defective in the development of hapten-induced contact hypersensitivity, which is attributed to the impaired trafficking of antigen-primed T cells to the hapten-challenged skin. We therefore suggest that AQP3-mediated H(2)O(2) uptake is required for chemokine-dependent T cell migration in sufficient immune response.
Figures
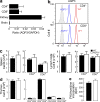
Figure 1.
Normal cellularity and subpopulations of T cells in AQP3-null mice. (a) The messenger RNA expression levels of AQP3 in sorted CD4+ and CD8+ T cells as well as in kidney and brain tissues were assessed by real-time PCR (SE; n = 4). Data are expressed as the AQP3/GAPDH ratio. (b) Flow cytometric analysis of AQP3 expression in CD4+ (top) or CD8+ (bottom) T cells from WT and AQP3−/− mice. (c) Cell population analysis in the spleen (left) and LN (right). The numbers of total cells, CD4+ and CD8+ cells from WT and AQP3−/− mice (SE; n = 4), are shown. (d) Cell population analysis in the thymus. The numbers of total cells and indicated subsets (SE; n = 4) are shown. (e) [3H]Thymidine incorporation in CD4+ T cells from WT and AQP3−/− mice (SE; n = 4–5). Each experiment was performed three times.
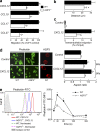
Figure 2.
Impaired chemotaxis efficiency and F-actin polymerization levels of AQP3-deficient T lymphocytes. (a) Chemotaxis assay. The migration efficiency of CD4+ T cells from WT and AQP3−/− mice toward the ligands CXCL12 (100 ng/ml), CCL19 (100 ng/ml), CCL17 (80 ng/ml), or CCL27 (80 ng/ml) was examined using a transwell chamber with 5-µm pores. Data are expressed as the percentage of WT control migration levels (SE; n = 5; *, P < 0.01). (b) Three-dimensional chemotaxis assay in response to CXCL12 gradient for 60 min. Accumulated distances for each cell (SE; n = 50; *, P < 0.01) are shown. (c) Transendothelial migration of CD4+ T cells through mouse vascular endothelial cells (F-2 cells) in the presence of 100 ng/ml CXCL12 (SE; n = 5; *, P < 0.01). (d) CD4+ WT and AQP3−/− T cells were stimulated with 500 ng/ml CXCL12 and stained with phalloidin-FITC (90 s) or with anti-AQP3 (3 min; cy3). (left) Representative immunofluorescence microscopy. Bars, 10 µm. (right) T cells were stimulated for 60 or 90 s with CXCL12. The aspect ratio of cell shape was quantified by measuring the length of the major axis divided by the width of the minor axis (SE; n = 50; *, P < 0.01). (e) T cells from WT and AQP3−/− mice were stimulated with 500 ng/ml CXCL12 and stained with phalloidin-FITC and CD4–Pacific blue. (left) Flow cytometry analysis of phalloidin-FITC gated on CD4+ cells. One of four representative experiments is shown. (right) The mean fluorescence intensity (MFI) of phalloidin-FITC in the CD4+ cells was analyzed (SE; n = 5; *, P < 0.01, WT vs. AQP3−/− cells). Each experiment was performed three times.
Figure 3.
Impaired CHS with decreased T cell trafficking to a challenged skin site in AQP3-null mice. (a, left) Mice were sensitized with DNFB, TNCB, or Oxa and challenged 5 d later on the ear. The ear thickness was measured in micrometers 24 h after the challenge (SE; n = 5; *, P < 0.01). (right) Hematoxylin and eosin staining of the ears of sensitized WT and AQP3−/− mice at 24 h after challenge with DNFB. Bars: (left) 100 µm; (right) 20 µm. (b) CHS test using BM cell–transferred mice. C57BL/6 mice received transplants of BM cells from WT and AQP3−/− mice. The CHS test was performed with DNFB 2 mo later (SE; n = 4; *, P < 0.01). (c) Adoptive transfer experiments by intravenous injection. LN cells from sensitized donor WT and AQP3−/− mice (Don) were injected intravenously (3 × 10⁷ cells/head) to recipient mice (Rec). Ear swelling at 24 h after challenge (SE; n = 3–5; *, P < 0.01) is shown. (d) Adoptive transfer experiments by intravenous injection. LN cells from sensitized WT and AQP3−/− donors were stained with CMFDA and injected into recipient WT mice, and these mice were challenged with 0.3% DNFB. The ear skin, which was painted with DNFB, and LNs were excised 24 h after challenge. CD4+ and CMDFA+ cells were analyzed by flow cytometric analysis (SE; n = 4; *, P < 0.01). (e) Adoptive transfer experiments by subcutaneous injection (2 × 10⁵ cells) into the ears. Ear swelling at 24 h after challenge is shown (SE; n = 4). Experiments in a, c, and e were performed in two other independent experiments and in b and d in one other experiment with similar results.
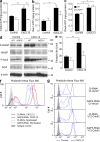
Figure 4.
Impaired chemokine-induced Cdc42 activation in AQP3-deficient T cells. (a–c) Quantifications of Cdc42, Rac1, and RhoA activation. T cells were incubated with 250 ng/ml CXCL12 for 1 min, and GTP-bound active form of Cdc42 (a), Rac1 (b), and RhoA (c) were assessed using the G-LISA activation assay kit (SE; n = 4–5; *, P < 0.05; **, P < 0.01). (d) Immunoblot analyses to detect the phosphorylation of WASP and Arp2. T cells were incubated with 250 ng/ml CXCL12 for 3 min and were analyzed using antibodies against phospho-WASP (P-WASP), WASP, phospho-Arp2, Arp2, and β-actin. The blots shown are representative of three separate sets of experiments. (e) Phosphorylated Itk in response to CXCL12 (250 ng/ml, 1 min) was quantified with BD cytometric bead array (SE; n = 4–5; **, P < 0.01). (f and g) F-actin polymerization in response to 500 ng/ml CXCL12 in AQP3 knockdown (f) and/or V12-Cdc42–positive human primary T cells (g). One representative experiment of three experiments is shown. Experiments in a–c and e were performed in two other independent experiments.
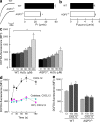
Figure 5.
Water and H2O2 permeability depended on AQP3 expression in T cells. (a) The osmotic water permeability of CD4+ T cells isolated from WT and AQP3−/− mice was measured based on the time course of scattered light intensity in response to a 150-mM inwardly directed mannitol gradient generated by stopped flow at 22°C. (left) Representative time course data showing responses to rapid changes in perfusate osmolality between 300 and 450 mOsm. (right) Averaged osmotic water permeability coefficients (_P_f; SE; n = 5; *, P < 0.01). (b) Glycerol permeability was measured in response to a 150-mM inwardly glycerol gradient by stopped flow at 30°C (SE; n = 4). (c) H2O2 uptake into T cells. CD4+ T cells were incubated with 10–300 µM H2O2 for 15 s, and cellular H2O2 levels were detected using CM-H2DCFDA reagent by flow cytometric analysis. The mean fluorescence intensity (MFI) of CM-H2DCFDA fluorescence (SE; n = 4; *, P < 0.01, H2O2 added vs. control cells) is shown. (d) WT CD4+ cells were incubated with 5 µM DPI or 2,000 U/ml catalase for 30 min and followed with 500 ng/ml CXCL12 for 15–180 s at 37°C. CD4+ cellular H2O2 levels were detected using CM-H2DCFDA reagent by flow cytometry analysis (SE; n = 5; *, P < 0.01, CXCL12 treated vs. control cells). (e) Cellular H2O2 levels in WT and AQP3−/− CD4+ cells after CXCL12 stimulation (500 ng/ml, 15 or 30 s; SE; n = 5; *, P < 0.01 vs. control cells). Each experiment was performed three times.
Figure 6.
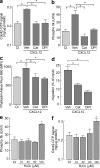
Intracellular H2O2 affects CXCL12-induced cell signaling and chemotaxis. (a–c) CD4+ T cells were incubated with 2,000 U/ml catalase (Cat), 5 µM DPI, or vehicle (Veh) for 30 min at 37°C and stimulated with 250 or 500 ng/ml CXCL12. (a) Quantification of Cdc42 active form (GTP bound) with G-LISA activation assay kit (SE; n = 4–5; *, P < 0.01). (b) Cytometric bead array–based quantification of phosphorylated Itk (SE; n = 4–5; *, P < 0.01). (c) Mean fluorescence intensity (MFI) of phalloidin–Alexa Fluor 660 in the CD4+ cells (SE; n = 5; *, P < 0.01). (d) Chemotaxis assay toward 100 ng/ml CXCL12 for 1 h (SE; n = 5; *, P < 0.01). (e and f) CD4+ T cells were incubated with 10–100 µM H2O2 for 1 min at 37°C. (e) Quantification of Cdc42 active form (GTP bound; SE; n = 4; *, P < 0.01). (f) The amount of phosphorylated Itk (SE; n = 4; *, P < 0.01). Experiments in a–d were performed in two other independent experiments and in e and f in one other experiment with similar results.
Figure 7.
H2O2 supplementation restored the impaired cell signaling and chemotaxis in AQP3-deficient T cells. (a–d) CD4+ T cells from WT and AQP3−/− mice were stimulated by 500 ng/ml CXCL12 together with/without exogenous addition of 100 µM H2O2. (a) Intracellular H2O2 levels for 15 s (SE; n = 4; *, P < 0.01, treated vs. control cells). (b) The amount of phosphorylated Itk (SE; n = 4; *, P < 0.01). (c) Quantification of Cdc42 active form (GTP bound; SE; n = 4; *, P < 0.01). (d) Mean fluorescence intensity (MFI) of phalloidin-FITC in the CD4+ cells was analyzed (SE; n = 4; *, P < 0.01). (e) T cells were incubated with 100 µM H2O2 for 15 s, washed, and assayed for chemotaxis for 30 min toward 200 ng/ml CXCL12 (SE; n = 5; *, P < 0.01). Experiments were performed in one other experiment with similar results.
Similar articles
- Aquaporin-3 Controls Breast Cancer Cell Migration by Regulating Hydrogen Peroxide Transport and Its Downstream Cell Signaling.
Satooka H, Hara-Chikuma M. Satooka H, et al. Mol Cell Biol. 2016 Feb 1;36(7):1206-18. doi: 10.1128/MCB.00971-15. Mol Cell Biol. 2016. PMID: 26830227 Free PMC article. - Aquaporin-3 potentiates allergic airway inflammation in ovalbumin-induced murine asthma.
Ikezoe K, Oga T, Honda T, Hara-Chikuma M, Ma X, Tsuruyama T, Uno K, Fuchikami J, Tanizawa K, Handa T, Taguchi Y, Verkman AS, Narumiya S, Mishima M, Chin K. Ikezoe K, et al. Sci Rep. 2016 May 11;6:25781. doi: 10.1038/srep25781. Sci Rep. 2016. PMID: 27165276 Free PMC article. - Involvement of aquaporin-3 in epidermal growth factor receptor signaling via hydrogen peroxide transport in cancer cells.
Hara-Chikuma M, Watanabe S, Satooka H. Hara-Chikuma M, et al. Biochem Biophys Res Commun. 2016 Mar 18;471(4):603-9. doi: 10.1016/j.bbrc.2016.02.010. Epub 2016 Feb 16. Biochem Biophys Res Commun. 2016. PMID: 26896765 - Expression, regulation and function of Aquaporin-3 in colonic epithelial cells.
Yde J, Keely SJ, Moeller HB. Yde J, et al. Biochim Biophys Acta Biomembr. 2021 Jul 1;1863(7):183619. doi: 10.1016/j.bbamem.2021.183619. Epub 2021 Mar 31. Biochim Biophys Acta Biomembr. 2021. PMID: 33811845 Review. - Roles of aquaporin-3 in the epidermis.
Hara-Chikuma M, Verkman AS. Hara-Chikuma M, et al. J Invest Dermatol. 2008 Sep;128(9):2145-51. doi: 10.1038/jid.2008.70. Epub 2008 Jun 12. J Invest Dermatol. 2008. PMID: 18548108 Review.
Cited by
- Aquaporin-3-mediated hydrogen peroxide transport is required for NF-κB signalling in keratinocytes and development of psoriasis.
Hara-Chikuma M, Satooka H, Watanabe S, Honda T, Miyachi Y, Watanabe T, Verkman AS. Hara-Chikuma M, et al. Nat Commun. 2015 Jun 23;6:7454. doi: 10.1038/ncomms8454. Nat Commun. 2015. PMID: 26100668 Free PMC article. - AQP3 and AQP9-Contrary Players in Sepsis?
Thon P, Rahmel T, Ziehe D, Palmowski L, Marko B, Nowak H, Wolf A, Witowski A, Orlowski J, Ellger B, Wappler F, Schwier E, Henzler D, Köhler T, Zarbock A, Ehrentraut SF, Putensen C, Frey UH, Anft M, Babel N, Sitek B, Adamzik M, Bergmann L, Unterberg M, Koos B, Rump K; SepsisDataNet.NRW Research Group. Thon P, et al. Int J Mol Sci. 2024 Jan 19;25(2):1209. doi: 10.3390/ijms25021209. Int J Mol Sci. 2024. PMID: 38279209 Free PMC article. - Innate-like functions of natural killer T cell subsets result from highly divergent gene programs.
Engel I, Seumois G, Chavez L, Samaniego-Castruita D, White B, Chawla A, Mock D, Vijayanand P, Kronenberg M. Engel I, et al. Nat Immunol. 2016 Jun;17(6):728-39. doi: 10.1038/ni.3437. Epub 2016 Apr 18. Nat Immunol. 2016. PMID: 27089380 Free PMC article. - An aquaporin 3-notch1 axis in keratinocyte differentiation and inflammation.
Guo L, Chen H, Li Y, Zhou Q, Sui Y. Guo L, et al. PLoS One. 2013 Nov 8;8(11):e80179. doi: 10.1371/journal.pone.0080179. eCollection 2013. PLoS One. 2013. PMID: 24260356 Free PMC article. - Prediction of aquaporin function by integrating evolutionary and functional analyses.
Perez Di Giorgio J, Soto G, Alleva K, Jozefkowicz C, Amodeo G, Muschietti JP, Ayub ND. Perez Di Giorgio J, et al. J Membr Biol. 2014 Feb;247(2):107-25. doi: 10.1007/s00232-013-9618-8. Epub 2013 Nov 29. J Membr Biol. 2014. PMID: 24292667 Review.
References
- Campbell J.J., Bowman E.P., Murphy K., Youngman K.R., Siani M.A., Thompson D.A., Wu L., Zlotnik A., Butcher E.C. 1998. 6-C-kine (SLC), a lymphocyte adhesion-triggering chemokine expressed by high endothelium, is an agonist for the MIP-3β receptor CCR7. J. Cell Biol. 141:1053–1059 10.1083/jcb.141.4.1053 - DOI - PMC - PubMed
Publication types
MeSH terms
Substances
LinkOut - more resources
Full Text Sources
Molecular Biology Databases
Miscellaneous
