Resolving conflict in eutherian mammal phylogeny using phylogenomics and the multispecies coalescent model - PubMed (original) (raw)
Resolving conflict in eutherian mammal phylogeny using phylogenomics and the multispecies coalescent model
Sen Song et al. Proc Natl Acad Sci U S A. 2012.
Erratum in
- Correction for Song et al., Resolving conflict in eutherian mammal phylogeny using phylogenomics and the multispecies coalescent model.
[No authors listed] [No authors listed] Proc Natl Acad Sci U S A. 2015 Nov 3;112(44):E6079. doi: 10.1073/pnas.1518753112. Epub 2015 Oct 26. Proc Natl Acad Sci U S A. 2015. PMID: 26504207 Free PMC article. No abstract available.
Abstract
The reconstruction of the Tree of Life has relied almost entirely on concatenation methods, which do not accommodate gene tree heterogeneity, a property that simulations and theory have identified as a likely cause of incongruent phylogenies. However, this incongruence has not yet been demonstrated in empirical studies. Several key relationships among eutherian mammals remain controversial and conflicting among previous studies, including the root of eutherian tree and the relationships within Euarchontoglires and Laurasiatheria. Both bayesian and maximum-likelihood analysis of genome-wide data of 447 nuclear genes from 37 species show that concatenation methods indeed yield strong incongruence in the phylogeny of eutherian mammals, as revealed by subsampling analyses of loci and taxa, which produced strongly conflicting topologies. In contrast, the coalescent methods, which accommodate gene tree heterogeneity, yield a phylogeny that is robust to variable gene and taxon sampling and is congruent with geographic data. The data also demonstrate that incomplete lineage sorting, a major source of gene tree heterogeneity, is relevant to deep-level phylogenies, such as those among eutherian mammals. Our results firmly place the eutherian root between Atlantogenata and Boreoeutheria and support ungulate polyphyly and a sister-group relationship between Scandentia and Primates. This study demonstrates that the incongruence introduced by concatenation methods is a major cause of long-standing uncertainty in the phylogeny of eutherian mammals, and the same may apply to other clades. Our analyses suggest that such incongruence can be resolved using phylogenomic data and coalescent methods that deal explicitly with gene tree heterogeneity.
Conflict of interest statement
The authors declare no conflict of interest.
Figures
Fig. 1.
Evolutionary relationships of eutherian mammals. The phylogeny was estimated using the maximum-pseudolikelihood coalescent method MP-EST with multilocus bootstrapping (8, 40). The numbers on the tree indicate bootstrap support values, and nodes with bootstrap support >90% are not shown. Branch lengths were estimated by fitting the concatenated sequence data for all 447 loci to the MP-EST topology using standard ML and an appropriate substitution model in PAUP* v.4.0 (45). (Inset) The eutherian phylogeny estimated using the Bayesian concatenation method implemented in MrBayes (22). The ML concatenation tree built by RAxML (23) is identical to the Bayesian concatenation tree in topology. Branches of the concatenation tree are coded by the same colors as in the MP-EST tree. The blue asterisks indicate the position of Scandentia (tree shrews), Chiroptera (bats), Perissodactyla (odd-toed ungulates), and Carnivora (carnivores), whose placement differs from the coalescent tree. The Bayesian concatenation tree received a posterior probability support of 1.0 for all nodes. In
SI Appendix, Fig. S2
, the concatenation tree with taxon names is shown.
Fig. 2.
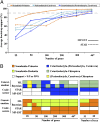
Trends in bootstrap support for coalescent analyses and incongruence of concatenation estimates for eutherian phylogeny. (A) Gradual increase in bootstrap support values with increasing gene numbers using coalescent methods for three clades: Scandentia–Primates within Euarchontoglires, Perissodactyla–Carnivora and Cetartiodactyla–(Perissodactyla, Carnivora) within Laurasiatheria. The gray dashed line indicates bootstrap support of 90%. (B) Concatenation analyses yield conflicting phylogenies within Euarchontoglires and Laurasiatheria for subsampled gene and taxon sets. We constructed coalescent and concatenation trees for different sets of 25, 50, 100, 200, and 300 genes randomly selected from the 447-gene set, with 10 replicates for each gene set except 447. We also constructed trees for two reduced taxon sets by excluding 6 and 12 eutherian taxa. White cells in the heatmap indicate that the support for all replicates is <0.9 or 90%. Colored cells indicate relationships that received node support values >0.9 or 90% for at least one replicate. Cells with two colors indicate two highly supported but conflicting relationships among different replicates. Note that the concatenation analyses frequently support conflicting relationships for different gene and taxon sets, whereas the coalescent methods consistently support the same topology.
Fig. 3.
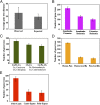
The mammal data set is consistent with the multispecies coalescent model. (A) Distribution of expected and observed gene tree distances. Expected gene trees were simulated from the MP-EST species tree under the multispecies coalescent model. Observed gene trees were estimated from the 447 genes in the full data set. Gene tree distances were calculated using standard measures (27). Note that the expected gene tree distance can account for about 77% of the observed gene tree distance. (B_–_E) Distribution of majority and minority gene tree triplets for specific eutherian clades. In cases where one of the three taxa in the triplet consists of multiple species, we counted the frequency of all relevant gene tree triplets for a given gene and then assigned the majority triplet to that gene. Ties were ignored, and hence the totals sometimes do not sum to 447 genes.
Comment in
- Concatenation versus coalescence versus "concatalescence".
Gatesy J, Springer MS. Gatesy J, et al. Proc Natl Acad Sci U S A. 2013 Mar 26;110(13):E1179. doi: 10.1073/pnas.1221121110. Epub 2013 Mar 4. Proc Natl Acad Sci U S A. 2013. PMID: 23460702 Free PMC article. No abstract available. - Reply to Gatesy and Springer: the multispecies coalescent model can effectively handle recombination and gene tree heterogeneity.
Wu S, Song S, Liu L, Edwards SV. Wu S, et al. Proc Natl Acad Sci U S A. 2013 Mar 26;110(13):E1180. doi: 10.1073/pnas.1300129110. Proc Natl Acad Sci U S A. 2013. PMID: 23650651 Free PMC article. No abstract available.
Similar articles
- The gene tree delusion.
Springer MS, Gatesy J. Springer MS, et al. Mol Phylogenet Evol. 2016 Jan;94(Pt A):1-33. doi: 10.1016/j.ympev.2015.07.018. Epub 2015 Jul 31. Mol Phylogenet Evol. 2016. PMID: 26238460 - Investigating Difficult Nodes in the Placental Mammal Tree with Expanded Taxon Sampling and Thousands of Ultraconserved Elements.
Esselstyn JA, Oliveros CH, Swanson MT, Faircloth BC. Esselstyn JA, et al. Genome Biol Evol. 2017 Sep 1;9(9):2308-2321. doi: 10.1093/gbe/evx168. Genome Biol Evol. 2017. PMID: 28934378 Free PMC article. - A new phylogenetic marker, apolipoprotein B, provides compelling evidence for eutherian relationships.
Amrine-Madsen H, Koepfli KP, Wayne RK, Springer MS. Amrine-Madsen H, et al. Mol Phylogenet Evol. 2003 Aug;28(2):225-40. doi: 10.1016/s1055-7903(03)00118-0. Mol Phylogenet Evol. 2003. PMID: 12878460 - Implementing and testing the multispecies coalescent model: A valuable paradigm for phylogenomics.
Edwards SV, Xi Z, Janke A, Faircloth BC, McCormack JE, Glenn TC, Zhong B, Wu S, Lemmon EM, Lemmon AR, Leaché AD, Liu L, Davis CC. Edwards SV, et al. Mol Phylogenet Evol. 2016 Jan;94(Pt A):447-62. doi: 10.1016/j.ympev.2015.10.027. Epub 2015 Oct 27. Mol Phylogenet Evol. 2016. PMID: 26518740 Review. - Origin of land plants using the multispecies coalescent model.
Zhong B, Liu L, Yan Z, Penny D. Zhong B, et al. Trends Plant Sci. 2013 Sep;18(9):492-5. doi: 10.1016/j.tplants.2013.04.009. Epub 2013 May 24. Trends Plant Sci. 2013. PMID: 23707196 Review.
Cited by
- The complete mitochondrial genome of Talpa martinorum (Mammalia: Talpidae), a mole species endemic to Thrace: genome content and phylogenetic considerations.
Demirtaş S, Budak M, Korkmaz EM, Searle JB, Bilton DT, Gündüz İ. Demirtaş S, et al. Genetica. 2022 Oct;150(5):317-325. doi: 10.1007/s10709-022-00162-w. Epub 2022 Aug 27. Genetica. 2022. PMID: 36029420 - STRAW: Species TRee Analysis Web server.
Shaw TI, Ruan Z, Glenn TC, Liu L. Shaw TI, et al. Nucleic Acids Res. 2013 Jul;41(Web Server issue):W238-41. doi: 10.1093/nar/gkt377. Epub 2013 May 9. Nucleic Acids Res. 2013. PMID: 23661681 Free PMC article. - Phylogenomic analyses of bat subordinal relationships based on transcriptome data.
Lei M, Dong D. Lei M, et al. Sci Rep. 2016 Jun 13;6:27726. doi: 10.1038/srep27726. Sci Rep. 2016. PMID: 27291671 Free PMC article. - An empirical evaluation of two-stage species tree inference strategies using a multilocus dataset from North American pines.
DeGiorgio M, Syring J, Eckert AJ, Liston A, Cronn R, Neale DB, Rosenberg NA. DeGiorgio M, et al. BMC Evol Biol. 2014 Mar 29;14:67. doi: 10.1186/1471-2148-14-67. BMC Evol Biol. 2014. PMID: 24678701 Free PMC article. - ASTRAL-III: polynomial time species tree reconstruction from partially resolved gene trees.
Zhang C, Rabiee M, Sayyari E, Mirarab S. Zhang C, et al. BMC Bioinformatics. 2018 May 8;19(Suppl 6):153. doi: 10.1186/s12859-018-2129-y. BMC Bioinformatics. 2018. PMID: 29745866 Free PMC article.
References
- de Queiroz A, Gatesy J. The supermatrix approach to systematics. Trends Ecol Evol. 2007;22(1):34–41. - PubMed
- William J, Ballard O. Combining data in phylogenetic analysis. Trends Ecol Evol. 1996;11:334. - PubMed
- Belfiore NM, Liu L, Moritz C. Multilocus phylogenetics of a rapid radiation in the genus Thomomys (Rodentia: Geomyidae) Syst Biol. 2008;57(2):294–310. - PubMed
- Edwards SV. Is a new and general theory of molecular systematics emerging? Evolution. 2009;63(1):1–19. - PubMed
- Kubatko LS, Degnan JH. Inconsistency of phylogenetic estimates from concatenated data under coalescence. Syst Biol. 2007;56(1):17–24. - PubMed
Publication types
MeSH terms
LinkOut - more resources
Full Text Sources
Other Literature Sources


