Insufficient autophagy promotes bronchial epithelial cell senescence in chronic obstructive pulmonary disease - PubMed (original) (raw)
. 2012 Aug 1;1(5):630-641.
doi: 10.4161/onci.20297.
Hiromichi Hara, Jun Araya, Naoki Takasaka, Jun Kojima, Saburo Ito, Shunsuke Minagawa, Yoko Yumino, Takeo Ishikawa, Takanori Numata, Makoto Kawaishi, Jun Hirano, Makoto Odaka, Toshiaki Morikawa, Stephen Nishimura, Katsutoshi Nakayama, Kazuyoshi Kuwano
Affiliations
- PMID: 22934255
- PMCID: PMC3429567
- DOI: 10.4161/onci.20297
Insufficient autophagy promotes bronchial epithelial cell senescence in chronic obstructive pulmonary disease
Satoko Fujii et al. Oncoimmunology. 2012.
Abstract
Tobacco smoke-induced accelerated cell senescence has been implicated in the pathogenesis of chronic obstructive pulmonary disease (COPD). Cell senescence is accompanied by the accumulation of damaged cellular components suggesting that in COPD, inhibition of autophagy may contribute to cell senescence. Here we look at whether autophagy contributes to cigarette smoke extract (CSE) - induced cell senescence of primary human bronchial epithelial cells (HBEC), and further evaluate p62 and ubiquitinated protein levels in lung homogenates from COPD patients. We demonstrate that CSE transiently induces activation of autophagy in HBEC, followed by accelerated cell senescence and concomitant accumulation of p62 and ubiquitinated proteins. Autophagy inhibition further enhanced accumulations of p62 and ubiquitinated proteins, resulting in increased senescence and senescence-associated secretory phenotype (SASP) with interleukin (IL)-8 secretion. Conversely, autophagy activation by Torin1, a mammalian target of rapamycin (mTOR inhibitor), suppressed accumulations of p62 and ubiquitinated proteins and inhibits cell senescence. Despite increased baseline activity, autophagy induction in response to CSE was significantly decreased in HBEC from COPD patients. Increased accumulations of p62 and ubiquitinated proteins were detected in lung homogenates from COPD patients. Insufficient autophagic clearance of damaged proteins, including ubiquitinated proteins, is involved in accelerated cell senescence in COPD, suggesting a novel protective role for autophagy in the tobacco smoke-induced senescence-associated lung disease, COPD.
Figures
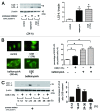
Figure 1. Autophagy activation in response to CSE exposure. (A) western blotting (WB) using anti-LC3 and anti-β-actin in control treated (lane 1, 2), rapamycin treated (1 μM) (lane 3, 4), CSE treated (lane 5 to 6) in the presence or absence of protease inhibitors (E64d 10 μg/ml and pepstatin A10 μg/ml) in Beas2B cells. Protein samples were collected after 24 h treatment with indicated concentrations of CSE. Shown is a representative experiment of three similar results. The right panel is the densitometric analysis of WB from three independent experiments. LC3-II / β-actin in the presence of protease inhibitors was subtracted by LC3-II / β-actin without protease inhibitors. *p < 0.05. (B) Fluorescence microscopic detection of pEGFP-LC3 dot formation in BEAS-2B cells: BEAS-2B cells with stable expression of pEGFP-LC3 were treated with bafilomycin A (200 nM), CSE (1.0%), or both bafilomycin A and CSE for 24h. Photomicrographs are taken at the same magnification. (Original magnification, 1000X) Bar = 10μm. The right panel is the percentage of positive cells with more than five dot formations and data were collected from three independent experiments. *p < 0.05. (C) WB using anti-LC3 and anti-β-actin for indicated time points of control or CSE (1.0%) treatment in the presence of protease inhibitors (E64d and pepstatin A) in HBEC from non-COPD patients. CSE treatment was started from 0h to sample collection and protease inhibitors were added during indicated time period. Shown is a representative experiment of three similar results. The lower panel is the relative increase of LC3-II after CSE exposure taken from densitometric analysis of WB. *p < 0.05.
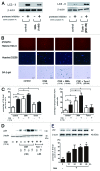
Figure 2. Involvement of autophagy in regulation of CSE-induced HBEC senescence. (A) The left panel is western blotting (WB) using anti-LC3 and anti-β-actin in control treated (lane 1, 2) and 3MA treated (1 mM) (lane 3, 4) and in the presence or absence of protease inhibitors (E64d 10 μg/ml and pepstatin A10 μg/ml) in HBEC. The right panel is western blotting (WB) using anti-LC3 and anti-β-actin in control treated (lane 1, 2) and Torin1 (250 nM) treated (lane 3, 4) in the presence or absence of protease inhibitors (E64d 10 μg/ml and pepstatin A10 μg/ml) in HBEC. Protein samples were collected after a 24 h treatment. Shown is a representative experiment of three similar results. (B) Photographs of immunofluorescent staining of phospho-Histone H2A.X (Ser139) (upper panels), Hoechst 33258 staining (middle panels), and senescence associated β-galactosidase (SA-β-gal) staining (lower panels) of control or CSE (1.0% for 48 h) treated HBEC in the presence or absence of 3MA (1.0 mM) and Torin1 (250 nM). Hoechst 33258 staining corresponds to phospho-Histone H2A.X staining. Bar = 50μm in IF and 100μm in SA-β-gal staining. (C) Shown in left panel is the percentage (± SEM) of SA-β-gal positive cells from three independent experiments. Open bar is no treatment and filled bar is CSE (1.0% for 48 h) treated in HBEC. *p < 0.05. **p < 0.001. Shown in right panel is the percentage (± SEM) of phospho-Histone H2A.X (Ser139) positive cells from three independent experiments. Open bar is no treatment and filled bar is CSE (1.0% for 48 h) treated in HBEC. *p < 0.05. (D) western blot (WB) using anti-p21 or β-actin in control treated (lane 1), CSE treated (lane 2), control treated in the presence of 3MA (1.0mM) (lane 3,4), CSE treated in the presence of 3MA (1mM) (lane 5,6), and CSE treated in the presence of torin1(lane 7,8) in HBEC. Protein samples were collected after 48 h treatment with CSE. Shown is a representative experiment of three similar results. (E) WB using anti-p62 or anti-β-actin of cell lysates from HBEC for indicated time points of control or 3MA (1mM) treatment (upper panels). SA-β-gal staining of indicated time points after 3MA (1mM) treatment in HBEC. Shown in lower panel is the percentage (± SEM) of SA-β-gal positive cells from three independent experiments. *p < 0.05.
Figure 3. Effect of LC3 and ATG5 knock down on CSE-induced cell senescence in HBEC. (A) RT-PCR (upper panel), using primers to LC3B and β-actin, was performed from total RNA harvested from control siRNA (lane 1) and LC3B siRNA (lane 2) transfected HBEC after 48 h incubation. WB (lower panel) using LC3 and anti- β-actin of cell lysates from control siRNA (lane 1) and LC3 siRNA (lane 2) transfected HBEC after 48 h in the presence of protease inhibitors (E64d 10 μg/ml and pepstatin A10 μg/ml). (B) Senescence associated β-galactosidase (SA-β-gal) staining of control or LC3B siRNA transfected HBEC. Shown in panel is the percentage (± SEM) of SA-β-gal positive cells from three independent experiments. Open bar is no treatment and filled bar is CSE (1.0% for 48 h) treated and horizontal crosshatched bar is CSE (2.5% for 48 h) treated. *p < 0.05. (C) western blot (WB) using anti-p21 or β-actin in control or LC3B siRNA transfected HBEC. HBEC were treated with control (lane 1, 4), CSE (1.0%) (lane 2, 5), and CSE (2.5%) (lane 3, 6). Protein samples were collected after 48 h treatment with CSE. Shown is a representative experiment of 3 showing similar results. (D) western blot (WB) using ATG5 and anti- β-actin of cell lysates from control siRNA (lane 1) and ATG5 siRNA (lane 2) transfected HBEC after 48 h. (E) Senescence associated β-galactosidase (SA-β-gal) staining of control or ATG5 siRNA transfected HBEC. Shown in panel is the percentage (± SEM) of SA-β-gal positive cells from three independent experiments. Open bar is no treatment and filled bar is CSE (1.0% for 48 h) treated. *p < 0.05. (F) western blot (WB) using anti-p21 or β-actin in control or ATG5 siRNA transfected HBEC. HBEC were treated with control (lanes 1 and 4), and CSE (1.0%) (lanes 2 and 4). Protein samples were collected after 48 h treatment with CSE. Shown is a representative experiment of three similar results.
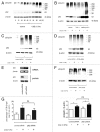
Figure 4. Accumulations of ubiquitinated protein and p62 in response to CSE exposure in HBEC. (A) WB using anti-ubiquitin, anti-p62, or anti- β-actin of cell lysates from HBEC for indicated time points of control or CSE (1.0%) treatment. Shown is a representative experiment of 3 showing similar results. (B) WB using anti-ubiquitin, anti-p62, or anti- β-actin. HBEC were exposed to CSE (1.0% for 48 h) in the absence (lane 1, 2) or presence of torin1 (250 nM) (lane 3, 4) and bafilomycin A (200 nM) (lane 5, 6). (C) WB using anti-ubiquitin, anti-p62, or anti- β-actin of cell lysates from control siRNA or LC3B siRNA transfected HBEC. CSE (1.0% for 48 h) treatment was started 24 h post-siRNA transfection. (D) WB using anti-ubiquitin, anti-p62, or anti- β-actin of cell lysates from control siRNA or ATG5 siRNA transfected HBEC. CSE (1.0% for 48 h) treatment was started 24 h post-siRNA transfection. (E) RT-PCR (upper panel), using primers to p62 and β-actin, was performed from total RNA harvested from control siRNA (lane 1) and p62 siRNA (lane 2) transfected HBEC after 48 h incubation. WB (lower panel) using anti-p62 and anti-β-actin of cell lysates from control siRNA (lane 1) and LC3 siRNA (lane 2) transfected HBEC after 48 h incubation. Shown is a representative experiment of 3 showing similar results. (F) WB using anti-ubiquitin and anti- β-actin of cell lysates from control siRNA or p62 siRNA transfected HBEC. CSE (1.0% for 48 h) treatment was started 24 h post-siRNA transfection. In the lower panel is the average (± SE) taken from densitometric analysis of WB of four independent experiments shown as relative expression of ubiquitin compared with β-actin. Open bar is no treatment and filled bar is CSE (1% for 48 h). (G) Shown in panel is the percentage (± SEM) of SA-β-gal positive cells from three independent experiments. Open bar is no treatment and filled bar is CSE (1.0% for 48 h) treated HBEC. ns = not significant
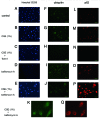
Figure 5. Immunofluorescence staining of ubiquitin and p62 in HBEC. Photomicrographs of nuclear staining with Hoechst 33258 (panels A to E), immunofluorescence staining with anti-ubiquitin (panels F to K), and anti-p62 (panels L to Q). HBEC were control treated (A, F, L) or CSE (1.0%) treated (B, C, E, G, H, J, K, M, N, P, and Q), in the presence of Torin1 (250 nM)(C, H, N), or bafilomycin A (200 nM) (D, E, I to K, O to Q). All photomicrographs are taken at the same magnification. Original magnification is × 200. Bar = 50 μm. K and Q are high magnification view.
Figure 6. IL-8 secretion by autophagy inhibition in CSE-induced senescent HBEC. For preparation of the conditioned medium, HBEC were treated with CSE (1.0%) in the absence or presence of Torin1 (250 nM) and bafilomycin A (200 nM) for 24h, washed three times with PBS, then incubated in fresh BEGM for 48h. (A) ELISA showing IL-8 in conditioned media with or without CSE-treatment in the absence (lane 1, 2), or presence of Torin1 (lane 3, 4) and bafilomycin A (lane 5, 6). Shown is the arbitrary units ± SEM *p < 0.05. **p < 0.001. (B) ELISA showing IL-8 in conditioned media from control siRNA (lane 1, 2) or LC3B siRNA (lane 3, 4) transfected HBEC. CSE (1.0% for 48 h) treatment was started 24 h post-siRNA transfection. Shown is the arbitrary units ± SEM *p < 0.05.
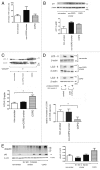
Figure 7. Autophagy activity in HBEC and lung homogenates from COPD patients. (A) Ki67 staining. Shown in panel is the average percentage (± SEM) of Ki67 positive cells in HBEC isolated from non-smoker (n = 5), smoker without COPD (n = 5), and COPD (n = 5). (B) WB using anti-p21 and anti-β-actin of cell lysates from HBEC isolated from nonsmokers (lane 1, 2, 3), non-COPD smokers (lane 4, 5, 6), and COPD patients (lane 7, 8, 9). The lower panel is the average (± SEM) taken from densitometric analysis of WB. Presented cases are non-smoker (n = 5), smoker without COPD (n = 5), and COPD (n = 5). (C) WB using anti-LC3 and anti-β-actin without CSE treatment in the presence of protease inhibitors (E64d and pepstatin A) in HBEC from nonsmokers (lane 1, 2, 3), non-COPD smokers (lane 4, 5, 6), and COPD patients (lane 7, 8, 9). The lower panel is the average (± SEM) taken from densitometric analysis of WB. Presented cases are non-smoker (n = 5), smoker without COPD (n = 5), and COPD (n = 5). (D) WB using anti-LC3 and anti-β-actin of control or CSE (1.0%) treatment in the presence or absence of protease inhibitors (E64d and pepstatin A) in HBEC (left panel). The lower panel is the average (± SEM) of relative increase in LC3-II normalized to β-actin following CSE exposure compared with control treated HBEC in the presence of protease inhibitors, which are taken from densitometric analysis of WB. Presented cases are non-smoker (n = 5), smoker without COPD (n = 5), and COPD (n = 5). (E) WB using anti-ubiquitin, anti-p62, or anti- β-actin of lung homogenates from non-smoker (n = 3), smoker without COPD (Brinkman Index < 900)(n = 3), smoker with COPD (Brinkman Index ≧900)(n = 3), and COPD (n = 3). The right panel is the average (± SEM) taken from densitometric analysis of WB using anti-ubiquitin.
References
Publication types
LinkOut - more resources
Full Text Sources
Other Literature Sources
Miscellaneous
