CDK inhibitors (p16/p19/p21) induce senescence and autophagy in cancer-associated fibroblasts, "fueling" tumor growth via paracrine interactions, without an increase in neo-angiogenesis - PubMed (original) (raw)
. 2012 Oct 1;11(19):3599-610.
doi: 10.4161/cc.21884. Epub 2012 Aug 30.
Affiliations
- PMID: 22935696
- PMCID: PMC3478311
- DOI: 10.4161/cc.21884
CDK inhibitors (p16/p19/p21) induce senescence and autophagy in cancer-associated fibroblasts, "fueling" tumor growth via paracrine interactions, without an increase in neo-angiogenesis
Claudia Capparelli et al. Cell Cycle. 2012.
Abstract
Here, we investigated the compartment-specific role of cell cycle arrest and senescence in breast cancer tumor growth. For this purpose, we generated a number of hTERT-immortalized senescent fibroblast cell lines overexpressing CDK inhibitors, such as p16(INK4A), p19(ARF) or p21(WAF1/CIP1). Interestingly, all these senescent fibroblast cell lines showed evidence of increased susceptibility toward the induction of autophagy (either at baseline or after starvation), as well as significant mitochondrial dysfunction. Most importantly, these senescent fibroblasts also dramatically promoted tumor growth (up to ~2-fold), without any comparable increases in tumor angiogenesis. Conversely, we generated human breast cancer cells (MDA-MB-231 cells) overexpressing CDK inhibitors, namely p16(INK4A) or p21(WAF1/CIP1). Senescent MDA-MB-231 cells also showed increased expression of markers of cell cycle arrest and autophagy, including β-galactosidase, as predicted. Senescent MDA-MB-231 cells had retarded tumor growth, with up to a near 2-fold reduction in tumor volume. Thus, the effects of CDK inhibitors are compartment-specific and are related to their metabolic effects, which results in the induction of autophagy and mitochondrial dysfunction. Finally, induction of cell cycle arrest with specific inhibitors (PD0332991) or cellular stressors [hydrogen peroxide (H(2)O(2)) or starvation] indicated that the onset of autophagy and senescence are inextricably linked biological processes. The compartment-specific induction of senescence (and hence autophagy) may be a new therapeutic target that could be exploited for the successful treatment of human breast cancer patients.
Figures
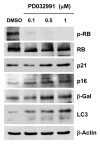
Figure 1. Treatment with PD0332991, a CDK4/6-inhibitor, induces markers of senescence and autophagy. hTERT-BJ1 fibroblasts were incubated with PD0332991 (0.1, 0.5 and 1 μM) for 36 h before the cells were harvested and subjected to immunoblot analysis with specific antibody probes. Note that PD0332991 effectively inhibits the phosphorylation of RB, as predicted. In addition, PD0332991 induces the upregulation of three markers of senescence [p21(WAF1/CIP1), p16(INK4A) and β-galactosidase]. Similarly, LC3 expression (an autophagy marker) is progressively upregulated. Blotting with β-actin is shown as a control for equal protein loading.
Figure 2. Acute treatment with hydrogen peroxide (H2O2) induces markers of senescence and autophagy. hTERT-BJ1 fibroblasts were treated for 1 h with H2O2 (300 μM) and then cultured for 0–8 d. Then, at each time point, the cells were harvested and subjected to immunoblot analysis. Blotting with β-actin is shown as a control for equal protein loading. (A) Markers of the cell cycle and senescence. Note that several markers of cell cycle arrest and senescence were increased at days 2 and 3 post-treatment [p53, p21(WAF1/CIP1) and β-galactosidase], while markers of cell cycle progression are decreased (phospho-RB and PCNA). (B) Markers of autophagy and mitophagy. Note that several markers of autophagy, mitophagy and lysosomes (Lamp-1, Beclin-1, BNIP3, cathepsin B and LC3) were increased, mainly at days 4–6 post-treatment.
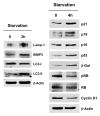
Figure 3. Acute starvation induces markers of autophagy and senescence. After 3 h of acute starvation with Hepes-buffered HBSS, several markers of autophagy were increased (Lamp-1, BNIP3, LC3). Similarly, after 4 h of acute starvation with HBSS, a panel of markers for cell cycle arrest [p21(WAF1/CIP1), p19(ARF), p16(INK4A), p53, β-galactosidase] were all increased. Conversely, markers of cell cycle progression were significantly decreased (phospho-RB and cyclin D1). Blotting with β-actin is shown as a control for equal protein loading.
Figure 4. Generating stable fibroblast cell lines which constitutively express smARF and p19(ARF). hTERT-BJ1 fibroblasts were transduced with lenti-viral vectors encoding smARF or p19(ARF) and then selected for puromycin-resistance. Control fibroblasts transduced with the empty vector (EV; Lv-105) were produced in parallel. Then, these stable cell lines were subjected to biochemical analysis. Blotting with β-actin is shown as a control for equal protein loading. (A) Treatment with the proteasome inhibitor MG-132. After overnight treatment (16 h) with MG-132 (10 μM), the cells were harvested and subjected to immunoblot analysis. Note that both smARF and p19(ARF) were stably expressed. (B) Acute treatment with H202. After acute treatment with H2O2 (300 μM), the fibroblasts were cultured for an additional 5 d to allow the onset of senescence. Note that fibroblasts transduced with smARF or p19(ARF) show the upregulation of p16(INK4A) and/or p21 (WAF1/CIP1), other CDK inhibitors. (C) As in (B), except the expression of Cav-1 was assessed. Note the 2-fold reduction in Cav-1 expression.
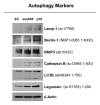
Figure 5. Both smARF and p19(ARF) expression increases the susceptibility of fibroblasts to the onset of autophagy. Stable fibroblast cell lines were acutely treated with H202 and cultured for an additional 5 d. Then, the expression of autophagy markers was assessed. Note that the expression of either smARF or p19(ARF) increases the levels of a panel of autophagy markers (Lamp-1, Beclin-1, BNIP3, cathepsin B, LC3 and legumain). Blotting with β-actin is shown as a control for equal protein loading.
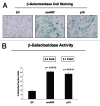
Figure 6. Both smARF and p19(ARF) expression increases the susceptibility of fibroblasts to the onset of senescence. Stable fibroblast cell lines were acutely treated with H202 and cultured for an additional 5 d. Then, the expression of β-galactosidase activity was assessed. Note that the expression of either smARF or p19(ARF) increases β-galactosidase activity by ~3-fold. Representative images are shown in (A), and quantitation is presented in (B).
Figure 7. p19(ARF) increases L-lactate production. Stable fibroblast cell lines were subjected to chronic hypoxia for 48 h. Then, the levels of L-lactate that accumulated in the tissue-culture media were assessed and normalized to the amount of total cellular protein. Note that p(19)ARF expression increases L-lactate accumulation by > 2-fold.
Figure 8. Fibroblasts overexpressing smARF or p19(ARF) promote tumor growth. Stable fibroblast cell lines were co-injected with MDA-MB-231(GFP) breast cancer cells into the flanks of immunodeficient mice. Then, tumor growth was followed for a period of 30 d post-injection. (A) shows the time course of tumor growth and (B) shows the final tumor volume at sacrifice, which resulted in a near 2-fold increase in tumor growth. (C) shows the results CD31 immunostaining, indicating that angiogenesis cannot account for the observed increase in tumor growth.
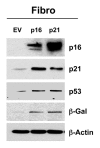
Figure 9. Generating stable fibroblast cell lines, which constitutively express p16(INK4A) and p21(WAF1/CIP1). hTERT-BJ1 fibroblasts were transduced with lenti-viral vectors encoding p16(INK4A) and p21(WAF1/CIP1) and then selected for puromycin-resistance. Control fibroblasts transduced with the empty vector (EV; Lv-105) were produced in parallel. Then, these stable cell lines were subjected to biochemical analysis. Note that after 6 d of culture, the overexpression of markers of cell cycle arrest and senescence [p16(INK4A, p21(WAF1/CIP1), p53 and β-galactosidase] is observed. Blotting with β-actin is shown as a control for equal protein loading.
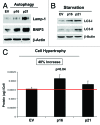
Figure 10. Stable fibroblast cell lines, which constitutively express p16(INK4A) and p21(WAF1/CIP1), show the onset of increased autophagy and/or cell hypertrophy. (A) Autophagy at baseline. Note that after 6 d of culture, the overexpression of markers of autophagy (Lamp-1 and BNIP3) is observed, especially in cells overexpressing p21(WAF1/CIP1). Blotting with β-actin is shown as a control for equal protein loading. (B) Autophagy after starvation. Note that after 12 h of starvation in Hepes-buffered HBSS, the overexpression of markers of autophagy (LC3-I/II) is observed, especially in cells overexpressing p21(WAF1/CIP1). Blotting with β-actin is shown as a control for equal protein loading. (C) Cell hypertrophy. Note that after 2 d of culture, cell hypertrophy is observed, especially in cells overexpressing p16(INK4A).
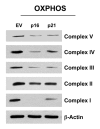
Figure 11. Fibroblast cell lines, which constitutively express p16(INK4A) and p21(WAF1/CIP1), show significant reductions in OXPHOS complex components. Note that after 6 d of culture, dramatic reductions in OXPHOS complex components is observed, especially complex I, III and V. Reductions were also observed in complex II and IV, but to a lesser extent. Blotting with β-actin is shown as a control for equal protein loading.
Figure 12. Fibroblasts overexpressing p16(INK4A) and p21(WAF1/CIP1) promote tumor growth in a paracrine fashion. Stable fibroblast cell lines were co-injected with MDA-MB-231(GFP) breast cancer cells into the flanks of immunodeficient mice. Then, tumor growth was followed for a period of 4 wk post-injection. (A) shows the final tumor volume at sacrifice, which resulted in a near 2-fold increase in tumor growth. (B) shows the results CD31 immunostaining, indicating that angiogenesis cannot account for the observed increase in tumor growth.
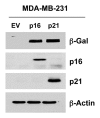
Figure 13. Generating MDA-MB-231 breast cancer cell lines, which overexpress p16(INK4A) and p21(WAF1/CIP1). MDA-MB-231(GFP) cells were transduced with lenti-viral vectors encoding p16(INK4A) and p21(WAF1/CIP1), and then selected for puromycin-resistance. Control cells transduced with the empty vector (EV; Lv-105) were produced in parallel. Then, these stable cell lines were subjected to biochemical analysis. Note the overexpression of markers of cell cycle arrest and senescence [p16(INK4A, p21(WAF1/CIP1) and β-galactosidase] is observed. Blotting with β-actin is shown as a control for equal protein loading.
Figure 14. MDA-MB-231 breast cancer cell lines, which overexpress p16(INK4A) and p21(WAF1/CIP1), show signs of senescence. (A) Cell hypertrophy. MDA-MB-231 cells, which overexpress p16(INK4A) and p21(WAF1/CIP1), morphologically appear flatter or hypertrophic. Representative phase images are shown. (B) Beta-galactosidase. MDA-MB-231 cells, which overexpress p16(INK4A) and p21(WAF1/CIP1), also appear to have increased β-galactosidase activity.
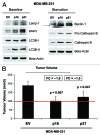
Figure 15. MDA-MB-231 breast cancer cell lines, which overexpress p16(INK4A) and p21(WAF1/CIP1), undergo autophagy, and show dramatically reduced tumor growth. (A) Autophagy status. MDA-MB-231 cells, which overexpress p16(INK4A) and p21(WAF1/CIP1), undergo increased authophagy, either at baseline (Lamp-1, BNIP3, LC3-I/II) or under conditions of starvation for 12 h with HBSS (Beclin-1 and cathepsin B). (B) Tumor growth. MDA-MB-231 cells, which overexpress p16(INK4A) and p21(WAF1/CIP1), show a near 2-fold reduction in tumor volume.
Figure 16. Understanding cell cycle arrest, senescence and autophagy: The sensescence-autophagy transition (SAT). Previously, we showed that recombinant expression of autophagy-associated genes (BNIP3, cathepsin B or ATG16L1) is sufficient to induce senescence, driving the autophagy-senescence transition (AST). Here, we show that recombinant expression of CDK inhibitors (p16/p19/p21) is sufficient to induce autophagy, driving the senescence-autophagy transition (SAT). Both SAT and AST result in mitochondrial dysfunction and a metabolic shift toward glycolysis, “powering down” cells during cell cycle arrest. Thus, cell cycle arrest, autophagy and senescence are all part of the same metabolic program that occurs in response to cellular stress.
Similar articles
- Compartment-specific activation of PPARγ governs breast cancer tumor growth, via metabolic reprogramming and symbiosis.
Avena P, Anselmo W, Whitaker-Menezes D, Wang C, Pestell RG, Lamb RS, Hulit J, Casaburi I, Andò S, Martinez-Outschoorn UE, Lisanti MP, Sotgia F. Avena P, et al. Cell Cycle. 2013 May 1;12(9):1360-70. doi: 10.4161/cc.24289. Epub 2013 Apr 10. Cell Cycle. 2013. PMID: 23574724 Free PMC article. - Differential roles for cyclin-dependent kinase inhibitors p21 and p16 in the mechanisms of senescence and differentiation in human fibroblasts.
Stein GH, Drullinger LF, Soulard A, Dulić V. Stein GH, et al. Mol Cell Biol. 1999 Mar;19(3):2109-17. doi: 10.1128/MCB.19.3.2109. Mol Cell Biol. 1999. PMID: 10022898 Free PMC article. - Autophagy and senescence in cancer-associated fibroblasts metabolically supports tumor growth and metastasis via glycolysis and ketone production.
Capparelli C, Guido C, Whitaker-Menezes D, Bonuccelli G, Balliet R, Pestell TG, Goldberg AF, Pestell RG, Howell A, Sneddon S, Birbe R, Tsirigos A, Martinez-Outschoorn U, Sotgia F, Lisanti MP. Capparelli C, et al. Cell Cycle. 2012 Jun 15;11(12):2285-302. doi: 10.4161/cc.20718. Epub 2012 Jun 15. Cell Cycle. 2012. PMID: 22684298 Free PMC article. - Cellular Senescence in Diabetes Mellitus: Distinct Senotherapeutic Strategies for Adipose Tissue and Pancreatic β Cells.
Murakami T, Inagaki N, Kondoh H. Murakami T, et al. Front Endocrinol (Lausanne). 2022 Mar 31;13:869414. doi: 10.3389/fendo.2022.869414. eCollection 2022. Front Endocrinol (Lausanne). 2022. PMID: 35432205 Free PMC article. Review. - [Cyclin dependent kinase inhibitors and replicative senescence].
Gerland LM, Ffrench M, Magaud JP. Gerland LM, et al. Pathol Biol (Paris). 2001 Dec;49(10):830-9. doi: 10.1016/s0369-8114(01)00249-8. Pathol Biol (Paris). 2001. PMID: 11776695 Review. French.
Cited by
- Tumor and stromal-based contributions to head and neck squamous cell carcinoma invasion.
Markwell SM, Weed SA. Markwell SM, et al. Cancers (Basel). 2015 Feb 27;7(1):382-406. doi: 10.3390/cancers7010382. Cancers (Basel). 2015. PMID: 25734659 Free PMC article. Review. - Therapy-Induced Cellular Senescence: Potentiating Tumor Elimination or Driving Cancer Resistance and Recurrence?
Liu Y, Lomeli I, Kron SJ. Liu Y, et al. Cells. 2024 Jul 30;13(15):1281. doi: 10.3390/cells13151281. Cells. 2024. PMID: 39120312 Free PMC article. Review. - Role of oxidative stress and the microenvironment in breast cancer development and progression.
Jezierska-Drutel A, Rosenzweig SA, Neumann CA. Jezierska-Drutel A, et al. Adv Cancer Res. 2013;119:107-25. doi: 10.1016/B978-0-12-407190-2.00003-4. Adv Cancer Res. 2013. PMID: 23870510 Free PMC article. Review. - Soluble egg antigens of Schistosoma japonicum induce senescence in activated hepatic stellate cells by activation of the STAT3/p53/p21 pathway.
Chen J, Pan J, Wang J, Song K, Zhu D, Huang C, Duan Y. Chen J, et al. Sci Rep. 2016 Aug 4;6:30957. doi: 10.1038/srep30957. Sci Rep. 2016. PMID: 27489164 Free PMC article. - lncRNA Malat1 and miR-26 cooperate in the regulation of neuronal progenitor cell proliferation and differentiation.
Was N, Sauer M, Fischer U, Becker M. Was N, et al. RNA. 2022 Oct 27;29(1):69-81. doi: 10.1261/rna.079436.122. Online ahead of print. RNA. 2022. PMID: 36302652 Free PMC article.
References
Publication types
MeSH terms
Substances
Grants and funding
- R01 CA075503/CA/NCI NIH HHS/United States
- R01 CA098779/CA/NCI NIH HHS/United States
- R01-CA-120876/CA/NCI NIH HHS/United States
- R01 CA120876/CA/NCI NIH HHS/United States
- R01-CA-70896/CA/NCI NIH HHS/United States
- R01-CA-098779/CA/NCI NIH HHS/United States
- R01-CA-86072/CA/NCI NIH HHS/United States
- R01-AR-055660/AR/NIAMS NIH HHS/United States
- R01-CA-080250/CA/NCI NIH HHS/United States
- R01 CA070896/CA/NCI NIH HHS/United States
- R01 CA107382/CA/NCI NIH HHS/United States
- P30 CA056036/CA/NCI NIH HHS/United States
- P30-CA-56036/CA/NCI NIH HHS/United States
- R01-CA-107382/CA/NCI NIH HHS/United States
- R01 AR055660/AR/NIAMS NIH HHS/United States
- R01-CA-75503/CA/NCI NIH HHS/United States
- R01 CA080250/CA/NCI NIH HHS/United States
- R01 CA086072/CA/NCI NIH HHS/United States
LinkOut - more resources
Full Text Sources
Other Literature Sources
Medical
Miscellaneous
