A census of human soluble protein complexes - PubMed (original) (raw)
. 2012 Aug 31;150(5):1068-81.
doi: 10.1016/j.cell.2012.08.011.
G Traver Hart, Tamás Nepusz, Haixuan Yang, Andrei L Turinsky, Zhihua Li, Peggy I Wang, Daniel R Boutz, Vincent Fong, Sadhna Phanse, Mohan Babu, Stephanie A Craig, Pingzhao Hu, Cuihong Wan, James Vlasblom, Vaqaar-un-Nisa Dar, Alexandr Bezginov, Gregory W Clark, Gabriel C Wu, Shoshana J Wodak, Elisabeth R M Tillier, Alberto Paccanaro, Edward M Marcotte, Andrew Emili
Affiliations
- PMID: 22939629
- PMCID: PMC3477804
- DOI: 10.1016/j.cell.2012.08.011
A census of human soluble protein complexes
Pierre C Havugimana et al. Cell. 2012.
Abstract
Cellular processes often depend on stable physical associations between proteins. Despite recent progress, knowledge of the composition of human protein complexes remains limited. To close this gap, we applied an integrative global proteomic profiling approach, based on chromatographic separation of cultured human cell extracts into more than one thousand biochemical fractions that were subsequently analyzed by quantitative tandem mass spectrometry, to systematically identify a network of 13,993 high-confidence physical interactions among 3,006 stably associated soluble human proteins. Most of the 622 putative protein complexes we report are linked to core biological processes and encompass both candidate disease genes and unannotated proteins to inform on mechanism. Strikingly, whereas larger multiprotein assemblies tend to be more extensively annotated and evolutionarily conserved, human protein complexes with five or fewer subunits are far more likely to be functionally unannotated or restricted to vertebrates, suggesting more recent functional innovations.
Copyright © 2012 Elsevier Inc. All rights reserved.
Figures
Figure 1. Integrative co-fractionation strategy used to identify human soluble protein Complexes
A- Cell extracts were extensively fractionated using different biochemical techniques (IEX, ion exchange chromatography; IEF, isoelectric focusing; SGF, sucrose density gradient centrifugation). Co-eluting proteins were identified by mass spectrometry and a co-elution network generated by calculating profile similarity (see Extended Experimental Procedures). B- Co-fractionation (IEX-HPLC) profiles of annotated subunits of 20 representative human protein complexes from HeLa nuclear extract. Shading indicates spectral counts recorded by LC-MS/MS. C- Hierarchical clustering of 5,584 proteins identified by LC-MS/MS. D- Protein abundance levels corresponding to components of our identified co-eluting proteins (red line), reconstructed complexes (blue) or annotated CORUM complexes (black) estimated from the reported HeLa proteome (Nagaraj et al., 2011). See also Figure S1 and Table S1.
Figure 2. Denoising the biochemical co-elution network and generation of high-confidence physical interactions
A- Biochemical co-fractionation network of 20 reference complexes with co-elution co-apex scores ≥2. Nodes represent protein subunits (colors reflect complex membership), while edges represent interactions (thickness proportional to the number of shared co-apexes). B- The biochemical data was combined with weighted functional association evidence using a random forest classifier and a training set of reference complexes (CORUM) to filter out spurious connections and infer a high-confidence interactome. The PPI and predicted clusters were evaluated with independent functional criteria to ensure high-quality. Arrows represent data flow, blue diamonds are attributes in the decision tree vector and green diamonds (leafs) are the final result (positive or negative). C- Cumulative precision-prediction rank curves for the LC-MS/MS data alone and after integration with genomic evidence. Incorporation of the functional evidence increased both precision (reduced false positives) and recall (more true positives). D- Network of 20 reference complexes after filtering with functional evidence. E- Overall correlation (Spearman r=0.40; n=11,675) of our scored human PPI with corresponding interaction scores reported for orthologous fly PPI from which validated, high confidence complexes were derived (Guruharsha et al., 2011). Heatmap shows prediction accuracy (log ratio of CORUM reference positives to negatives), with high-scoring pairs in both studies highly enriched for positives. F- Precision-recall curve showing performance reconstructing withheld reference CORUM complexes highlighted by red dots at the threshold at which half of the protein pairs per complex are recovered. See also Figure S5 and Table S2.
Figure 3. Global validations of the map of high confidence human protein complexes
A- Complex size distribution of the 622 inferred complexes. B- Network of predicted human protein complexes proportioned according to subunit number and displaying existing curations, validation status by AP/MS (Malovannaya et al., 2011), and PPI connectivity (proportioned edge width). C- Proportions of annotated complexes in public repositories (CORUM, PINdb, REACTOME, HPRD) or independently experimentally-verified. D- Enrichment analysis showing overlap with large-scale APMS datasets generated for human (Hutchins et al., 2010; Malovannaya et al., 2011) and (via orthology) fly (Guruharsha et al., 2011). See also Table S3.
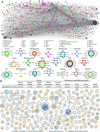
Figure 4. Global map of high confidence human protein complexes
A- Schematic of the global network of inferred human soluble protein complexes (colored by membership), with representative examples and supporting PPI highlighted. B- Putative complexes with 2 or more components with human disorder associations annotated in UniProt (The UniProt Consortium, 2011), Online Inheritance of Man (OMIM)(Hamosh et al., 2005) or the Genetic Association Database (GAD)(Becker et al., 2004). Inset table shows highly significant interaction overlap (i.e., shared annotated edges) with phenotypic datasets that reveals protein subunits of the same predicted human complex tend to exhibit similar disease and genetic associations in human populations (see Extended Experimental Procedures), RNAi phenotypes in cell culture (Neumann et al., 2010), mutational and RNAi phenotypes in other species (via orthology), and shared transcriptional regulatory motifs (Xie et al., 2005). See also Figure S4C, and Table S4.
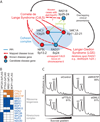
Figure 5. Membership in complexes predicts protein function and disease associations
A- Three of four proteins mapped to the cohesin complex account for roughly half of cases of the human congenital disorder Cornelia de Lange syndrome (Pie et al., 2010), implicating the fourth component, RAD21, as a candidate disease gene. This association may explain similarities in clinical presentation between CdLS and Langer-Giedion syndrome, as the latter patients routinely harbor RAD21 deletions, e.g. (McBrien et al., 2008; Wuyts et al., 2002). B- Confirmation of ribosome biogenesis candidate (orange) associations with annotated components (blue) by AP/MS analysis of tagged proteins (top). Colored squares indicate validation (see Extended Experimental Procedures). C- Polysome profiling after siRNA targeting in tissue culture supports functional roles in ribosome biogenesis for three candidate proteins. Knockdown of MKI67IP, FTSJ3, and to a lesser extent GNL3, results in 60S ribosomal subunit biogenesis defects manifested by a reduced ratio of free 60S to 40S ribosomal subunits during gradient sedimentation as compared to control. Percentages indicate siRNA knockdown efficiency as measured by qRT-PCR.
Figure 6. Evolutionary conservation of protein complexes
A- Components of predicted human complexes evolved more slowly, calculated as the average of evolutionary rate ratios, compared to the entire set of expressed proteins (see Extended Experimental Procedures). B- Pronounced spike in number of complexes originated with the emergence of vertebrates. X-axis shows increasingly inclusive orthologous groups in the phylogeny of eukaryotes. C- Human complexes conserved in fly (Guruharsha et al., 2011), and yeast (Babu et al., 2012)(see Table S3 and Extended Experimental Procedures). Nodes represent complexes (human, blue; fly, green; yeast, orange), with size proportional to subunit number. Reciprocal best matches shown as dark grey edges, non-reciprocal as lighter grey directed edges, with edge thickness proportional to Sorensen-Dice overlap of complex members. Human complexes absent from public databases (putative complexes) are drawn as rectangles, the remaining as circles. D- Similar tissue-specific expression patterns support a functional association between interacting proteins ENPL and GLU2B, whose orthologs were reported to interact in fly (Guruharsha et al., 2011). Panels show representative antibody staining in normal tissue biopsies collected and reported by the Human Protein Atlas (Uhlen et al., 2010)(
). See also Figure S3 and Table S3.
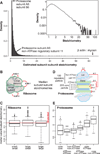
Figure 7. Protein complex stoichiometries
A- Overall distribution of derived intra-complex component stoichiometries B, C- Estimated subunit stoichiometries within and between proteins of the large and small ribosome subunits agree on average with the expected 1:1 ratio. Boxes summarize first quartile, median and third quartiles, whiskers represent +/− 1.5 IQR and circles outliers. D, E- Estimated protein subunit stoichiometries within and between proteasomal proteins. Intra-subunit stoichiometries within the core, ATPase, or nonATPase regulatory subunits agree well with the expected 1:1 ratio, but stoichiometries observed between these complexes deviate significantly from 1:1 (ATPase:non-ATPase, Mann-Whitney p ≤ 10−3; core:ATPase, p ≤ 10−12; core:non-ATPase, p ≤ 10ȡ16). See also Table S2.
Comment in
- Interactomes by mass spectrometry.
Doerr A. Doerr A. Nat Methods. 2012 Nov;9(11):1043. doi: 10.1038/nmeth.2235. Nat Methods. 2012. PMID: 23281565 No abstract available.
Similar articles
- Analysis of protein complexes in Arabidopsis leaves using size exclusion chromatography and label-free protein correlation profiling.
Aryal UK, McBride Z, Chen D, Xie J, Szymanski DB. Aryal UK, et al. J Proteomics. 2017 Aug 23;166:8-18. doi: 10.1016/j.jprot.2017.06.004. Epub 2017 Jun 13. J Proteomics. 2017. PMID: 28627464 - Strategy for high-throughput identification of protein complexes by array-based multi-dimensional liquid chromatography-mass spectrometry.
Wang X, Yan G, Zheng H, Gao M, Zhang X. Wang X, et al. J Chromatogr A. 2021 Aug 30;1652:462351. doi: 10.1016/j.chroma.2021.462351. Epub 2021 Jun 15. J Chromatogr A. 2021. PMID: 34174714 - Panorama of ancient metazoan macromolecular complexes.
Wan C, Borgeson B, Phanse S, Tu F, Drew K, Clark G, Xiong X, Kagan O, Kwan J, Bezginov A, Chessman K, Pal S, Cromar G, Papoulas O, Ni Z, Boutz DR, Stoilova S, Havugimana PC, Guo X, Malty RH, Sarov M, Greenblatt J, Babu M, Derry WB, Tillier ER, Wallingford JB, Parkinson J, Marcotte EM, Emili A. Wan C, et al. Nature. 2015 Sep 17;525(7569):339-44. doi: 10.1038/nature14877. Epub 2015 Sep 7. Nature. 2015. PMID: 26344197 Free PMC article. - Interaction proteomics: characterization of protein complexes using tandem affinity purification-mass spectrometry.
Völkel P, Le Faou P, Angrand PO. Völkel P, et al. Biochem Soc Trans. 2010 Aug;38(4):883-7. doi: 10.1042/BST0380883. Biochem Soc Trans. 2010. PMID: 20658971 Review. - Unraveling the dynamics of protein interactions with quantitative mass spectrometry.
Ramisetty SR, Washburn MP. Ramisetty SR, et al. Crit Rev Biochem Mol Biol. 2011 Jun;46(3):216-28. doi: 10.3109/10409238.2011.567244. Epub 2011 Mar 26. Crit Rev Biochem Mol Biol. 2011. PMID: 21438726 Review.
Cited by
- Protein-protein interaction networks: probing disease mechanisms using model systems.
Kuzmanov U, Emili A. Kuzmanov U, et al. Genome Med. 2013 Apr 30;5(4):37. doi: 10.1186/gm441. eCollection 2013. Genome Med. 2013. PMID: 23635424 Free PMC article. Review. - The Bucentaur (BCNT) protein family: a long-neglected class of essential proteins required for chromatin/chromosome organization and function.
Messina G, Celauro E, Atterrato MT, Giordano E, Iwashita S, Dimitri P. Messina G, et al. Chromosoma. 2015 Jun;124(2):153-62. doi: 10.1007/s00412-014-0503-8. Epub 2014 Dec 31. Chromosoma. 2015. PMID: 25547403 Review. - Human monogenic disease genes have frequently functionally redundant paralogs.
Chen WH, Zhao XM, van Noort V, Bork P. Chen WH, et al. PLoS Comput Biol. 2013;9(5):e1003073. doi: 10.1371/journal.pcbi.1003073. Epub 2013 May 16. PLoS Comput Biol. 2013. PMID: 23696728 Free PMC article. - Co-fractionation-mass spectrometry to characterize native mitochondrial protein assemblies in mammalian neurons and brain.
Zilocchi M, Rahmatbakhsh M, Moutaoufik MT, Broderick K, Gagarinova A, Jessulat M, Phanse S, Aoki H, Aly KA, Babu M. Zilocchi M, et al. Nat Protoc. 2023 Dec;18(12):3918-3973. doi: 10.1038/s41596-023-00901-z. Epub 2023 Nov 20. Nat Protoc. 2023. PMID: 37985878 - Mapping the multiscale structure of biological systems.
Schaffer LV, Ideker T. Schaffer LV, et al. Cell Syst. 2021 Jun 16;12(6):622-635. doi: 10.1016/j.cels.2021.05.012. Cell Syst. 2021. PMID: 34139169 Free PMC article. Review.
References
- Alberts B. The cell as a collection of protein machines: preparing the next generation of molecular biologists. Cell. 1998;92:291–294. - PubMed
- Babu M, Vlasblom J, Pu S, Guo X, Graham C, Bean BDM, Vizeacoumar FJ, Burston HE, Snider J, Phanse S, et al. Interaction Landscape of Membrane Protein Complexes in Saccharomyces cerevisiae. Nature. 2012 - PubMed
- Becker KG, Barnes KC, Bright TJ, Wang SA. The genetic association database. Nat Genet. 2004;36:431–432. - PubMed
- Bouwmeester T, Bauch A, Ruffner H, Angrand PO, Bergamini G, Croughton K, Cruciat C, Eberhard D, Gagneur J, Ghidelli S, et al. A physical and functional map of the human TNF-alpha/NF-kappa B signal transduction pathway. Nat Cell Biol. 2004;6:97–105. - PubMed
Publication types
MeSH terms
Substances
Grants and funding
- MOP 82940/CAPMC/ CIHR/Canada
- R01 GM088624/GM/NIGMS NIH HHS/United States
- BB/K004131/1/BB_/Biotechnology and Biological Sciences Research Council/United Kingdom
- R01 GM076536/GM/NIGMS NIH HHS/United States
- DP1 GM106408/GM/NIGMS NIH HHS/United States
- R01 GM067779/GM/NIGMS NIH HHS/United States
- BB/F00964X/1/BB_/Biotechnology and Biological Sciences Research Council/United Kingdom
LinkOut - more resources
Full Text Sources
Other Literature Sources
Molecular Biology Databases
Miscellaneous


