The sigma-1 receptor binds to the Nav1.5 voltage-gated Na+ channel with 4-fold symmetry - PubMed (original) (raw)
The sigma-1 receptor binds to the Nav1.5 voltage-gated Na+ channel with 4-fold symmetry
Dilshan Balasuriya et al. J Biol Chem. 2012.
Abstract
The sigma-1 receptor (Sig1R) is up-regulated in many human tumors and plays a role in the control of cancer cell proliferation and invasiveness. At the molecular level, the Sig1R modulates the activity of various ion channels, apparently through a direct interaction. We have previously shown using atomic force microscopy imaging that the Sig1R binds to the trimeric acid-sensing ion channel 1A with 3-fold symmetry. Here, we investigated the interaction between the Sig1R and the Nav1.5 voltage-gated Na(+) channel, which has also been implicated in promoting the invasiveness of cancer cells. We show that the Sig1R and Nav1.5 can be co-isolated from co-transfected cells, consistent with an intimate association between the two proteins. Atomic force microscopy imaging of the co-isolated proteins revealed complexes in which Nav1.5 was decorated by Sig1Rs. Frequency distributions of angles between pairs of bound Sig1Rs had two peaks, at ∼90° and ∼180°, and the 90° peak was about twice the size of the 180° peak. These results demonstrate that the Sig1R binds to Nav1.5 with 4-fold symmetry. Hence, each set of six transmembrane regions in Nav1.5 likely constitutes a Sig1R binding site, suggesting that the Sig1R interacts with the transmembrane regions of its partners. Interestingly, two known Sig1R ligands, haloperidol and (+)-pentazocine, disrupted the Nav1.5/Sig1R interaction both in vitro and in living cells. Finally, we show that endogenously expressed Sig1R and Nav1.5 also functionally interact.
Figures
FIGURE 1.
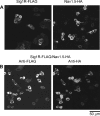
Expression of the Sig1R and Nav1.5 in transfected tsA 201 cells. A, cells were singly transfected with either Sig1R-FLAG (left panel) or Nav1.5-HA (right panel). Cells were fixed, permeabilized and incubated with either mouse monoclonal anti-FLAG or mouse monoclonal anti-HA antibodies, followed by a Cy3-conjugated goat anti-mouse secondary antibody. Cells were imaged by confocal laser scanning microscopy. B, cells were co-transfected with Sig1R-FLAG and Nav1.5-HA. Cells were fixed, permeabilized, and incubated with both mouse monoclonal anti-FLAG and rabbit polyclonal anti-HA antibodies, followed by fluorescein isothiocyanate-conjugated goat anti-mouse and Cy3-conjugated goat anti-rabbit secondary antibodies. Cells were imaged by confocal laser scanning microscopy. Scale bar, 50 μm.
FIGURE 2.
Isolation and AFM imaging of the Sig1R from singly transfected tsA 201 cells. A, detergent extracts of Sig1R-FLAG-transfected and control cells were analyzed by SDS-PAGE followed by immunoblotting using either a mouse monoclonal anti-FLAG antibody (bottom panel) or a rabbit polyclonal anti-Sig1R antibody (top panel). B and C, samples of protein isolated by immunoaffinity chromatography on anti-FLAG-agarose were analyzed by SDS-PAGE followed by either Coomassie Blue staining (B) or immunoblotting using a mouse monoclonal anti-FLAG antibody (C). Arrowheads indicate molecular mass markers (kDa). D, low-magnification AFM image of a sample of isolated Sig1R. E, gallery of enlarged images of Sig1R particles. F, frequency distribution of volumes of Sig1R particles. The curve indicates the fitted Gaussian function. The peak of the distribution is indicated.
FIGURE 3.
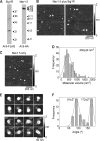
Isolation and analysis of Sig1R-FLAG·Nav1.5-HA complexes by immunoaffinity chromatography on anti-HA agarose. A, samples of protein isolated by immunoaffinity chromatography were analyzed by SDS-PAGE followed by immunoblotting using either mouse monoclonal anti-FLAG (left panel) or mouse monoclonal anti-HA antibodies (right panel). Arrowheads indicate molecular mass markers (kDa). B, low-magnification AFM images of samples of isolated Sig1R-FLAG/Nav1.5. Singly and doubly decorated large particles are indicated by arrowheads and an arrow, respectively. C, low-magnification AFM image of Nav1.5 alone, isolated by immunoaffinity chromatography on anti-HA-agarose. D, frequency distribution of volumes of large particles isolated from co-transfected cells that were decorated by Sig1R particles. The curve indicates the fitted Gaussian function. The peak of the distribution is indicated. E, gallery of zoomed images of Nav1.5 channels that were decorated by either one (upper panels) or two Sig1Rs (lower panels). Angles between pairs of bound Sig1Rs are indicated. F, frequency distribution of angles between pairs of bound Sig1Rs. The curve indicates the fitted Gaussian functions. The peaks of the distribution are indicated.
FIGURE 4.
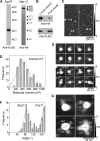
Isolation and analysis of Sig1R-FLAG·Nav1.5-HA complexes by immunoaffinity chromatography on anti-FLAG-agarose. A, samples of protein isolated by affinity chromatography were analyzed by SDS-PAGE followed by immunoblotting using either mouse monoclonal anti-FLAG (left panel) or mouse monoclonal anti-HA antibodies (right panel). Arrowheads indicate molecular mass markers (kDa). B, a sample of protein isolated from surface-biotinylated, intact co-transfected cells by sequential affinity chromatography on monomeric avidin-agarose and anti-FLAG-agarose was analyzed by SDS-PAGE followed by immunoblotting using either mouse monoclonal anti-FLAG (bottom panel) or mouse monoclonal anti-HA antibodies (top panel). A crude detergent extract of the cells (at a loading ratio of 1:128 compared with the final eluate) was also analyzed. C, low-magnification AFM images of samples of isolated Sig1R-FLAG/Nav1.5. Singly- and doubly-decorated large particles are indicated by arrowheads and an arrow, respectively. D, frequency distribution of volumes of large particles that were decorated by Sig1R particles. The curve indicates the fitted Gaussian function. The peak of the distribution is indicated. E, gallery of enlarged images of Nav1.5 channels that were decorated by either one (upper panels) or two Sig1Rs (lower panels). Angles between pairs of bound Sig1Rs are indicated. F, frequency distribution of angles between pairs of bound Sig1Rs. The curve indicates the fitted Gaussian functions. The peaks of the distribution are indicated. G, gallery of zoomed images of Nav1.5 particles decorated by one, two, three, or four Sig1R particles. Angles between pairs of bound Sig1Rs are indicated.
FIGURE 5.
Effect of Sig1R ligands on the interaction between the Sig1R and Nav1.5. A, the Sig1R was isolated from Sig1R-FLAG/Nav1.5-HA co-transfected cells by immunoaffinity chromatography on anti-FLAG agarose. The Sig1R ligands haloperidol (Sigma; 100 μ
m
) and (+)-pentazocine (Sigma; 10 μ
m
) were incubated with identical samples of a crude detergent extract of the cells for 1 h at 4 °C before addition to the immunobeads. Samples of isolated protein were analyzed by SDS-polyacrylamide gel electrophoresis followed by immunoblotting using either mouse monoclonal anti-HA (top panel) or anti-FLAG antibodies (bottom panel). The immunoblots shown are representative of the results from three separate experiments. A crude detergent extract of the cells (at a loading ratio of 1:32 compared with the final eluate) was also analyzed. B, cells were co-transfected with DNA encoding Nav1.5-HA and Sig1R-FLAG. Haloperidol (100 μ
m
) and (+)-pentazocine (10 μ
m
) were added to the media for 1 h before the cells were fixed. Cells were permeabilized and incubated with primary antibodies (rabbit polyclonal anti-HA and mouse monoclonal anti-FLAG) followed by anti-mouse (+) and anti-rabbit (−) proximity ligation secondary antibodies. The proximity ligation assay was then carried out and treated cells were imaged by confocal laser scanning microscopy. All images were captured using identical microscope settings. Scale bar, 50 μm.
FIGURE 6.
Sig1R expression regulates Nav1.5 current density in MDA-MB-231 cells. A, immunoblot showing the shRNA-induced knock-down of Sig1R expression in MDA-MB-231 cells. α-Tubulin is shown as a control (antibody from Sigma). B, representative Na+ currents elicited in Sig1R knockdown or control MDA-MB-231 cells by a series of depolarization pulses between +60 and −80 mV from a holding potential of −100 mV. C, current-voltage relationship of the Na+ current obtained from a holding potential of −100 mV (n = 10 cells). *, p < 0.05, Mann-Whitney test.
Similar articles
- The σ-1 receptor interacts directly with GluN1 but not GluN2A in the GluN1/GluN2A NMDA receptor.
Balasuriya D, Stewart AP, Edwardson JM. Balasuriya D, et al. J Neurosci. 2013 Nov 13;33(46):18219-24. doi: 10.1523/JNEUROSCI.3360-13.2013. J Neurosci. 2013. PMID: 24227730 Free PMC article. - Voltage-gated sodium channel modulation by sigma-receptors in cardiac myocytes and heterologous systems.
Johannessen M, Ramachandran S, Riemer L, Ramos-Serrano A, Ruoho AE, Jackson MB. Johannessen M, et al. Am J Physiol Cell Physiol. 2009 May;296(5):C1049-57. doi: 10.1152/ajpcell.00431.2008. Epub 2009 Mar 11. Am J Physiol Cell Physiol. 2009. PMID: 19279232 Free PMC article. - A direct interaction between the sigma-1 receptor and the hERG voltage-gated K+ channel revealed by atomic force microscopy and homogeneous time-resolved fluorescence (HTRF®).
Balasuriya D, D'Sa L, Talker R, Dupuis E, Maurin F, Martin P, Borgese F, Soriani O, Edwardson JM. Balasuriya D, et al. J Biol Chem. 2014 Nov 14;289(46):32353-32363. doi: 10.1074/jbc.M114.603506. Epub 2014 Sep 29. J Biol Chem. 2014. PMID: 25266722 Free PMC article. - Allosteric Modulators of Sigma-1 Receptor: A Review.
Vavers E, Zvejniece L, Maurice T, Dambrova M. Vavers E, et al. Front Pharmacol. 2019 Mar 19;10:223. doi: 10.3389/fphar.2019.00223. eCollection 2019. Front Pharmacol. 2019. PMID: 30941035 Free PMC article. Review. - Sigma-1 receptor and seizures.
Vavers E, Zvejniece L, Dambrova M. Vavers E, et al. Pharmacol Res. 2023 May;191:106771. doi: 10.1016/j.phrs.2023.106771. Epub 2023 Apr 15. Pharmacol Res. 2023. PMID: 37068533 Free PMC article. Review.
Cited by
- Gating control of the cardiac sodium channel Nav1.5 by its β3-subunit involves distinct roles for a transmembrane glutamic acid and the extracellular domain.
Salvage SC, Zhu W, Habib ZF, Hwang SS, Irons JR, Huang CLH, Silva JR, Jackson AP. Salvage SC, et al. J Biol Chem. 2019 Dec 20;294(51):19752-19763. doi: 10.1074/jbc.RA119.010283. Epub 2019 Oct 28. J Biol Chem. 2019. PMID: 31659116 Free PMC article. - The sigma-1 receptor modulates dopamine transporter conformation and cocaine binding and may thereby potentiate cocaine self-administration in rats.
Hong WC, Yano H, Hiranita T, Chin FT, McCurdy CR, Su TP, Amara SG, Katz JL. Hong WC, et al. J Biol Chem. 2017 Jul 7;292(27):11250-11261. doi: 10.1074/jbc.M116.774075. Epub 2017 May 11. J Biol Chem. 2017. PMID: 28495886 Free PMC article. - Potassium and Calcium Channel Complexes as Novel Targets for Cancer Research.
Potier-Cartereau M, Raoul W, Weber G, Mahéo K, Rapetti-Mauss R, Gueguinou M, Buscaglia P, Goupille C, Le Goux N, Abdoul-Azize S, Lecomte T, Fromont G, Chantome A, Mignen O, Soriani O, Vandier C. Potier-Cartereau M, et al. Rev Physiol Biochem Pharmacol. 2022;183:157-176. doi: 10.1007/112_2020_24. Rev Physiol Biochem Pharmacol. 2022. PMID: 32767122 - Proliferation of embryonic cardiomyocytes in zebrafish requires the sodium channel scn5Lab.
Bennett JS, Stroud DM, Becker JR, Roden DM. Bennett JS, et al. Genesis. 2013 Aug;51(8):562-74. doi: 10.1002/dvg.22400. Epub 2013 Jun 25. Genesis. 2013. PMID: 23650201 Free PMC article. - Sigma-1 Receptor Signaling: In Search of New Therapeutic Alternatives for Cardiovascular and Renal Diseases.
Munguia-Galaviz FJ, Miranda-Diaz AG, Cardenas-Sosa MA, Echavarria R. Munguia-Galaviz FJ, et al. Int J Mol Sci. 2023 Jan 19;24(3):1997. doi: 10.3390/ijms24031997. Int J Mol Sci. 2023. PMID: 36768323 Free PMC article. Review.
References
- Monnet F. P. (2005) Sigma-1 receptor as regulator of neuronal intracellular Ca2+: clinical and therapeutic relevance. Biol. Cell 97, 873–883 - PubMed
- Aydar E., Palmer C. P., Klyachko V. A., Jackson M. B. (2002) The sigma receptor as a ligand-regulated auxiliary potassium channel subunit. Neuron 34, 399–410 - PubMed
Publication types
MeSH terms
Substances
LinkOut - more resources
Full Text Sources
Miscellaneous


