Parkin prevents cortical atrophy and Aβ-induced alterations of brain metabolism: ¹³C NMR and magnetic resonance imaging studies in AD models - PubMed (original) (raw)
Parkin prevents cortical atrophy and Aβ-induced alterations of brain metabolism: ¹³C NMR and magnetic resonance imaging studies in AD models
Norah Algarzae et al. Neuroscience. 2012.
Abstract
Alzheimer's disease (AD) is a neurodegenerative aging disorder characterized by extracellular Aβ plaques and intraneuronal neurofibrillary tangles. We conducted longitudinal studies to examine the effects of Aβ on brain amino acid metabolism in lentiviral Aβ(1-42) gene transfer animals and transgenic AD mice. We also performed lentiviral parkin gene delivery to determine the effects of Aβ clearance in AD models. Aβ(1-42) activated mTOR signaling, and increased 4E-BP phosphorylation. Aβ(1-42) increased the synthesis of glutamate and aspartate, but not glutamine, leucine and isoleucine, but an increase in leucine and isoleucine levels was concurrent with diminution of neurotransmitters. Additionally, Aβ(1-42) attenuated mitochondrial tricarboxylic acid (TCA) cycle activity and decreased synthesis of its by-products. Glutamate levels increased prior to lactate accumulation, suggesting oxidative stress. Importantly, parkin reversed the effects of Aβ(1-42) on amino acid levels, prevented TCA cycle impairment and protected against glutamate toxicity. Cortical atrophy was observed in aged 3xTg-AD mice, while parkin expression was associated with reduced atrophy. Similarly, Aβ(1-42) resulted in significant cell loss, pronounced astrogliosis and cortical atrophy and parkin reduced astrogliosis and reversed Aβ(1-42) effects on cell loss and cortical atrophy. Taken together these data suggest that parkin prevents amyloid-induced alteration of brain metabolism and may be used as a therapeutic target to limit neuronal loss in AD.
Copyright © 2012 IBRO. Published by Elsevier Ltd. All rights reserved.
Conflict of interest statement
Conflicts of interest and sources of funding. The authors declare no conflict of interest in association with this manuscript.
Figures
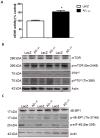
Figure 1. Aβ1-42 expression activates mTOR 4E-BP signaling
A). Histograms represent ELISA measurement of mTOR activity in immunoprecipitated cortical lysates. B). Western blot analysis of cortical brain lysates on 10% SDS NuPAGE gel showing total mTOR levels (1st blot) phosphorylated mTOR at Ser 2448 (2nd blot) and total p70S6k (3rd blot) and phosphorylated p70S6k levels at Thr 389 (4th blot) compared to actin control. C). Western blot analysis of cortical brain lysates on 4–12% SDS NuPAGE gel showing total 4E-BP1 levels (1st blot) phosphorylated 4E-BP1 at Thr 37/46 (2nd blot) and phosphorylated eIF-4E at Ser 209 (3rd blot) compared to actin control. Asterisk indicates significantly different, ANOVA, Mann Whitney, P<0.05, N=8.
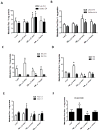
Figure 2. High frequency 13C/1H NMR spectroscopy shows alterations of amino acid levels and parkin restores neurotransmitter balance
Histograms represent A). Flux of 13C label from glucose into leucine C4 (Leu) and isoleucine C4 (Isoleu) and B). Pool size of total leucine and isoleucine in rat hemispheres injected with lentiviral parkin, parkin+Aβ1-42, Aβ1-42 or LacZ. C). Flux of 13C label into glutamate C4 (Glu) and glutamine C4 (Gln) and D). Pool size of total glutamate and glutamine. E). Flux of 13C label into aspartate C2 and C3 (Asp) and F). Pool size of total aspartate. * indicates significantly different, ANOVA, Mann Whitney, P<0.05, N=5.
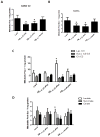
Figure 3. High frequency 13C/1H NMR spectroscopy shows decreased GABA and TCA cycle activity and parkin counteracts oxidative stress
Histograms represent A). Flux of 13C label from glucose into GABA C2 and B). Pool size of total GABA in rat hemispheres injected with lentiviral parkin, parkin+Aβ1-42, Aβ1-42 or LacZ. C). Flux of 13C label into lactate C3 (Lac), succinate C3 (Succ) and citrate C2 (Cit) and D). Pool size of total lactate, succinate and citrate. * indicates significantly different, ANOVA, Mann Whitney, P<0.05, N=4.
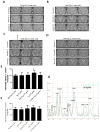
Figure 4. Parkin reduces brain atrophy in 3xTg-AD mice
A). MRI brain scans of 1 year old 3xTg-AD mice and, B). and 1 year old non-Tg (control) mice. C). MRI brain scans of 3xTg-AD mice injected with lentiviral parkin in the right hemisphere, compared to LacZ-injected left hemisphere. Arrowheads indicate cortical brain atrophy. D). MRI brain scans of 1.5 year old non-Tg control mice. Histograms represent quantification by segmentation of E). ventricular and F). intracranial volumes. G). Spectra obtained by MRS showing Taurine (Tau) levels. Bars are mean+/−SD, N=11 each treatment, P<0.05, ANOVA Mann Whitney. Lv: Lentivirus. Asterisk indicates significantly different to all other conditions.
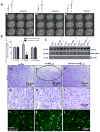
Figure 5. Parkin reverses cortical atrophy in Aβ1-42 gene transfer animal models
A). MRI scans of rat brain injected with lentiviral Aβ1-42+lentiviral LacZ in the left hemisphere and lentiviral Aβ1-42+lentiviral parkin in the right hemisphere. Arrowheads indicate cortical atrophy. B). Histograms represent quantification of intracranial and ventricular volume. C). Western blot analysis of the levels of inflammatory markers TNF-β and iNOS in the cortex of gene transfer animal models (N=6). Cortical 20m thick sections showing cresyl violet (Nissl) staining in lentiviral D). parkin, E). Aβ1-42, circle indicates cell loss and F). parkin+ Aβ1-42 injected brains. Higher view magnification show cell morphology in G). parkin, H). Aβ1-42 and I). parkin+Aβ1-42 injected brains. Anti-GFAP immunoreactivity in brains injected with lentiviral J). parkin, K). Aβ1-42 and L). Aβ1-42+parkin. Bars are mean+−/−SD, N=6 each treatment, P<0.05, ANOVA Mann Whitney. Lv: Lentivirus. Asterisk indicates significantly different to all other conditions.
Similar articles
- Parkin mediates beclin-dependent autophagic clearance of defective mitochondria and ubiquitinated Abeta in AD models.
Khandelwal PJ, Herman AM, Hoe HS, Rebeck GW, Moussa CE. Khandelwal PJ, et al. Hum Mol Genet. 2011 Jun 1;20(11):2091-102. doi: 10.1093/hmg/ddr091. Epub 2011 Mar 4. Hum Mol Genet. 2011. PMID: 21378096 Free PMC article. - Intraneuronal beta-amyloid accumulation in the amygdala enhances fear and anxiety in Alzheimer's disease transgenic mice.
España J, Giménez-Llort L, Valero J, Miñano A, Rábano A, Rodriguez-Alvarez J, LaFerla FM, Saura CA. España J, et al. Biol Psychiatry. 2010 Mar 15;67(6):513-21. doi: 10.1016/j.biopsych.2009.06.015. Epub 2009 Aug 7. Biol Psychiatry. 2010. PMID: 19664757 - Alzheimer's disease.
De-Paula VJ, Radanovic M, Diniz BS, Forlenza OV. De-Paula VJ, et al. Subcell Biochem. 2012;65:329-52. doi: 10.1007/978-94-007-5416-4_14. Subcell Biochem. 2012. PMID: 23225010 Review. - Alzheimer's disease and amyloid: culprit or coincidence?
Skaper SD. Skaper SD. Int Rev Neurobiol. 2012;102:277-316. doi: 10.1016/B978-0-12-386986-9.00011-9. Int Rev Neurobiol. 2012. PMID: 22748834 Review.
Cited by
- Long noncoding RNAs and Alzheimer's disease.
Luo Q, Chen Y. Luo Q, et al. Clin Interv Aging. 2016 Jun 29;11:867-72. doi: 10.2147/CIA.S107037. eCollection 2016. Clin Interv Aging. 2016. PMID: 27418812 Free PMC article. Review. - Parkin reverses TDP-43-induced cell death and failure of amino acid homeostasis.
Hebron M, Chen W, Miessau MJ, Lonskaya I, Moussa CE. Hebron M, et al. J Neurochem. 2014 Apr;129(2):350-61. doi: 10.1111/jnc.12630. Epub 2013 Dec 19. J Neurochem. 2014. PMID: 24298989 Free PMC article. - Parkin as a Molecular Bridge Linking Alzheimer's and Parkinson's Diseases?
Checler F, Alves da Costa C. Checler F, et al. Biomolecules. 2022 Apr 9;12(4):559. doi: 10.3390/biom12040559. Biomolecules. 2022. PMID: 35454148 Free PMC article. Review. - Progressive Vascular Abnormalities in the Aging 3xTg-AD Mouse Model of Alzheimer's Disease.
Jullienne A, Quan R, Szu JI, Trinh MV, Behringer EJ, Obenaus A. Jullienne A, et al. Biomedicines. 2022 Aug 13;10(8):1967. doi: 10.3390/biomedicines10081967. Biomedicines. 2022. PMID: 36009514 Free PMC article. - Neuroimaging of Mouse Models of Alzheimer's Disease.
Jullienne A, Trinh MV, Obenaus A. Jullienne A, et al. Biomedicines. 2022 Jan 28;10(2):305. doi: 10.3390/biomedicines10020305. Biomedicines. 2022. PMID: 35203515 Free PMC article. Review.
References
- Alafuzoff I, Arzberger T, Al-Sarraj S, Bodi I, Bogdanovic N, Braak H, Bugiani O, Del-Tredici K, Ferrer I, Gelpi E, Giaccone G, Graeber MB, Ince P, Kamphorst W, King A, Korkolopoulou P, Kovacs GG, Larionov S, Meyronet D, Monoranu C, Parchi P, Patsouris E, Roggendorf W, Seilhean D, Tagliavini F, Stadelmann C, Streichenberger N, Thal DR, Wharton SB, Kretzschmar H. Staging of neurofibrillary pathology in Alzheimer’s disease: a study of the BrainNet Europe Consortium. Brain Pathol. 2008;18:484–496. - PMC - PubMed
- Avruch J, Hara K, Lin Y, Liu M, Long X, Ortiz-Vega S, Yonezawa K. Insulin and amino-acid regulation of mTOR signaling and kinase activity through the Rheb GTPase. Oncogene. 2006;25:6361–6372. - PubMed
- Billings LM, Oddo S, Green KN, McGaugh JL, LaFerla FM. Intraneuronal Abeta causes the onset of early Alzheimer’s disease-related cognitive deficits in transgenic mice. Neuron. 2005;45:675–688. - PubMed
- Bubber P, Haroutunian V, Fisch G, Blass JP, Gibson GE. Mitochondrial abnormalities in Alzheimer brain: mechanistic implications. Ann Neurol. 2005;57:695–703. - PubMed
Publication types
MeSH terms
Substances
LinkOut - more resources
Full Text Sources
Medical
Molecular Biology Databases
Miscellaneous
