Targeted proteomic quantification on quadrupole-orbitrap mass spectrometer - PubMed (original) (raw)
Targeted proteomic quantification on quadrupole-orbitrap mass spectrometer
Sebastien Gallien et al. Mol Cell Proteomics. 2012 Dec.
Abstract
There is an immediate need for improved methods to systematically and precisely quantify large sets of peptides in complex biological samples. To date protein quantification in biological samples has been routinely performed on triple quadrupole instruments operated in selected reaction monitoring mode (SRM), and two major challenges remain. Firstly, the number of peptides to be included in one survey experiment needs to be increased to routinely reach several hundreds, and secondly, the degree of selectivity should be improved so as to reliably discriminate the targeted analytes from background interferences. High resolution and accurate mass (HR/AM) analysis on the recently developed Q-Exactive mass spectrometer can potentially address these issues. This instrument presents a unique configuration: it is constituted of an orbitrap mass analyzer equipped with a quadrupole mass filter as the front-end for precursor ion mass selection. This configuration enables new quantitative methods based on HR/AM measurements, including targeted analysis in MS mode (single ion monitoring) and in MS/MS mode (parallel reaction monitoring). The ability of the quadrupole to select a restricted m/z range allows one to overcome the dynamic range limitations associated with trapping devices, and the MS/MS mode provides an additional stage of selectivity. When applied to targeted protein quantification in urine samples and benchmarked with the reference SRM technique, the quadrupole-orbitrap instrument exhibits similar or better performance in terms of selectivity, dynamic range, and sensitivity. This high performance is further enhanced by leveraging the multiplexing capability of the instrument to design novel acquisition methods and apply them to large targeted proteomic studies for the first time, as demonstrated on 770 tryptic yeast peptides analyzed in one 60-min experiment. The increased quality of quadrupole-orbitrap data has the potential to improve existing protein quantification methods in complex samples and address the pressing demand of systems biology or biomarker evaluation studies.
Figures
Fig. 1.
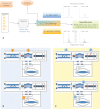
Targeted proteomic workflow employing the quadrupole-orbitrap mass spectrometer. A, From the proteins of interest defined in the context of a biological question, a set of peptides used as surrogates is selected and specifically analyzed. The targeted analysis of the peptides requires a minimal set of instrument control parameters (precursor ion m/z value and chromatographic retention time window) and can be conducted using two main operation modes of the quadrupole-orbitrap instrument: the selected ion monitoring (SIM) mode, relying on single-stage mass spectrometry, and the parallel reaction monitoring (PRM) mode, relying on tandem mass spectrometry. B, In SIM mode, a limited m/z range including the precursor ions of interest is isolated by the quadrupole (1), transmitted and accumulated in the C-trap (2), and finally transferred and analyzed in the orbitrap mass analyzer (3). The actual quantification of endogenous peptides is performed on the peak areas of corresponding precursor ions. C, In PRM mode, a limited m/z range including the precursor ions of interest is isolated by the quadrupole (1), transmitted via the C-trap to the HCD cell where corresponding fragment ions are generated and accumulated (2). Fragment ions are then transferred back into the C-trap (3) and eventually injected and analyzed in the orbitrap mass analyzer (4). The actual quantification of endogenous peptides is performed on the peak areas of corresponding selected fragment ions.
Fig. 2.
Acquisition methods for targeted quantification experiments. A, Sequential SIM method (left panel). Target ions are individually and sequentially isolated by the quadrupole in narrow windows, accumulated in the C-trap, and eventually transferred in the orbitrap to be detected. B, Simultaneous SIM method (left panel). All target ions are isolated by the quadrupole in one single window and then accumulated in the C-trap and detected in the orbitrap simultaneously. C, Multiplexed SIM method (left panel). Target ions are sequentially isolated in multiple windows by the quadrupole and accumulutated in the C-trap, where they are stored together before being finally detected in the orbitrap in one single scan. All these methods can be used in conjunction with the PRM modes (right panel). In this case, the HCD cell is used as the temporary accumulation/storage device for fragment ions.
Fig. 3.
Comparison of the analytical performance of multiplexed SIM (A) and full scan MS (B) analyses. The dilution curves were obtained from one single LC/MS analysis with both acquisition methods on a set of isotopolog peptides (Table I) prepared in various amounts (between 5 amol and 10.9 fmol, with a 3-fold dilution factor for each point) in 500 ng of yeast digest. The linearity range of the dilution curves is displayed in the upper panel (i.e., 45 amol to 10.9 fmol for SIM analysis and 405 amol to 10.9 fmol for full scan analysis) (
supplementary data 1
). The corresponding mass spectra at the apex of the elution profile are shown in the bottom panel, along with corresponding zoomed image. Detected precursor ions of isotopologs are indicated by dark blue circles or light blue circles for measurements that lie in or out of the linear range, respectively.
Fig. 4.
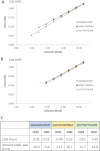
Quantification of endogenous human transferrin in urine samples using SIM and SRM analysis. Three isotopically labeled peptides representing the protein were spiked in various amounts in urine samples to obtain their dilution series. The dilution curves were established for each pair of endogenous/isotopically labeled peptides from the AUC ratios calculated on predefined precursor ions (SIM) or transitions (SRM). A, Linearity range of the dilution curves obtained from SIM analysis. B, Linearity range of the dilution curves obtained from SRM analysis. C, A lower LOQ was determined for two peptides via SIM analysis (DGAGDVAFV_K_ and EGYYGYTGAF_R_), whereas SRM analysis provided a lower LOQ for the third one (SASDLTWDNL_K_). The amounts of endogenous peptides were determined with less than 10% difference between the techniques.
Fig. 5.
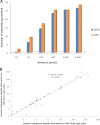
Comparison of quantification results obtained with SIM and SRM analysis. A, Numbers of peptides that could be quantified with each technique at the different amounts of the dilution series. B, Correlation between the amounts of endogenous peptides determined via SIM analysis (_y_-axis) and SRM analysis (_x_-axis). Only determined amounts higher than corresponding LOQs are displayed and were used to calculate the linear regression.
Fig. 6.
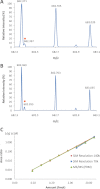
Selectivity of measurements in SIM and PRM modes. The peptide SDLAVPSELALL_K_ was spiked at a concentration of 4 fmol/μl in 1 μg/μl of urine digest. A, SIM mass spectrum acquired in the m/z range of 681.40–683.40 at a resolution of 70,000 (at m/z 200). The doubly charged ion (m/z 682.40, [M+2H]2+) of the peptide SDLAVPSELALL_K_ (orange circle) is interfered with by ions of similar m/z (m/z 682.37, [M+3H]3+). B, SIM mass spectrum acquired at a resolution of 140,000 (at m/z 200). Doubling the resolution allowed us to distinguish the ion of interest (orange circle) from interferences. C, Linearity range of the dilution curves established by SIM (resolutions of 70,000 and 140,000) and PRM analyses from the dilution series of SDLAVPSELALL_K_ (2 amol/μ
l
to 40 fmol/μl) prepared in 1 μg/μl of urine digest. The LOQ of 20 amol observed with SIM analysis at a resolution of 140,000 and PRM analysis is a significant improvement over the LOQ observed with SIM analysis at a resolution of 70,000.
Similar articles
- Technical considerations for large-scale parallel reaction monitoring analysis.
Gallien S, Bourmaud A, Kim SY, Domon B. Gallien S, et al. J Proteomics. 2014 Apr 4;100:147-59. doi: 10.1016/j.jprot.2013.10.029. Epub 2013 Nov 4. J Proteomics. 2014. PMID: 24200835 - Mass spectrometry-based proteomics using Q Exactive, a high-performance benchtop quadrupole Orbitrap mass spectrometer.
Michalski A, Damoc E, Hauschild JP, Lange O, Wieghaus A, Makarov A, Nagaraj N, Cox J, Mann M, Horning S. Michalski A, et al. Mol Cell Proteomics. 2011 Sep;10(9):M111.011015. doi: 10.1074/mcp.M111.011015. Epub 2011 Jun 3. Mol Cell Proteomics. 2011. PMID: 21642640 Free PMC article. - Parallel reaction monitoring using quadrupole-Orbitrap mass spectrometer: Principle and applications.
Bourmaud A, Gallien S, Domon B. Bourmaud A, et al. Proteomics. 2016 Aug;16(15-16):2146-59. doi: 10.1002/pmic.201500543. Epub 2016 May 27. Proteomics. 2016. PMID: 27145088 Review. - A review on mass spectrometry-based quantitative proteomics: Targeted and data independent acquisition.
Vidova V, Spacil Z. Vidova V, et al. Anal Chim Acta. 2017 Apr 29;964:7-23. doi: 10.1016/j.aca.2017.01.059. Epub 2017 Feb 2. Anal Chim Acta. 2017. PMID: 28351641 Review. - Large-Scale Targeted Proteomics Using Internal Standard Triggered-Parallel Reaction Monitoring (IS-PRM).
Gallien S, Kim SY, Domon B. Gallien S, et al. Mol Cell Proteomics. 2015 Jun;14(6):1630-44. doi: 10.1074/mcp.O114.043968. Epub 2015 Mar 9. Mol Cell Proteomics. 2015. PMID: 25755295 Free PMC article.
Cited by
- Automated High-Throughput Biological Sex Identification from Archeological Human Dental Enamel Using Targeted Proteomics.
Koenig C, Bortel P, Paterson RS, Rendl B, Madupe PP, Troché GB, Hermann NV, Martínez de Pinillos M, Martinón-Torres M, Mularczyk S, Schjellerup Jørkov ML, Gerner C, Kanz F, Martinez-Val A, Cappellini E, Olsen JV. Koenig C, et al. J Proteome Res. 2024 Nov 1;23(11):5107-5121. doi: 10.1021/acs.jproteome.4c00557. Epub 2024 Sep 26. J Proteome Res. 2024. PMID: 39324540 Free PMC article. - Determination of Site-Specific Phosphorylation Occupancy Using Targeted Mass Spectrometry Reveals the Regulation of Human Apical Bile Acid Transporter, ASBT.
Nguyen TT, Kane MA, Swaan PW. Nguyen TT, et al. ACS Omega. 2024 Aug 30;9(37):38477-38489. doi: 10.1021/acsomega.4c02999. eCollection 2024 Sep 17. ACS Omega. 2024. PMID: 39310206 Free PMC article. - Concatemer Assisted Stoichiometry Analysis (CASA): targeted mass spectrometry for protein quantification.
Cai J, Yun Q, Zhang CY, Wang Z, Hinshaw SM, Zhou H, Suhandynata RT. Cai J, et al. bioRxiv [Preprint]. 2024 Jul 27:2024.07.26.605382. doi: 10.1101/2024.07.26.605382. bioRxiv. 2024. PMID: 39091769 Free PMC article. Preprint. - Ribosomal protein RPL39L is an efficiency factor in the cotranslational folding of a subset of proteins with alpha helical domains.
Banerjee A, Ataman M, Smialek MJ, Mookherjee D, Rabl J, Mironov A, Mues L, Enkler L, Coto-Llerena M, Schmidt A, Boehringer D, Piscuoglio S, Spang A, Mittal N, Zavolan M. Banerjee A, et al. Nucleic Acids Res. 2024 Aug 27;52(15):9028-9048. doi: 10.1093/nar/gkae630. Nucleic Acids Res. 2024. PMID: 39041433 Free PMC article. - Histone variant H2BE enhances chromatin accessibility in neurons to promote synaptic gene expression and long-term memory.
Feierman ER, Louzon S, Prescott NA, Biaco T, Gao Q, Qiu Q, Choi K, Palozola KC, Voss AJ, Mehta SD, Quaye CN, Lynch KT, Fuccillo MV, Wu H, David Y, Korb E. Feierman ER, et al. Mol Cell. 2024 Aug 8;84(15):2822-2837.e11. doi: 10.1016/j.molcel.2024.06.025. Epub 2024 Jul 17. Mol Cell. 2024. PMID: 39025074
References
- Aebersold R., Mann M. (2003) Mass spectrometry-based proteomics. Nature 422, 198–207 - PubMed
- Domon B., Aebersold R. (2006) Mass spectrometry and protein analysis. Science 312, 212–217 - PubMed
- Aebersold R. (2009) A stress test for mass spectrometry-based proteomics. Nat. Methods 6, 411–412 - PubMed
- Domon B., Aebersold R. (2010) Options and considerations when selecting a quantitative proteomics strategy. Nat. Biotechnol. 28, 710–721 - PubMed
- Anderson N. L., Anderson N. G. (2002) The human plasma proteome: history, character, and diagnostic prospects. Mol. Cell. Proteomics 1, 845–867 - PubMed
Publication types
MeSH terms
Substances
LinkOut - more resources
Full Text Sources
Other Literature Sources
Molecular Biology Databases


