The small GTPase RhoG mediates glioblastoma cell invasion - PubMed (original) (raw)
The small GTPase RhoG mediates glioblastoma cell invasion
Aneta Kwiatkowska et al. Mol Cancer. 2012.
Abstract
Background: The invasion of glioblastoma cells into regions of the normal brain is a critical factor that limits current therapies for malignant astrocytomas. Previous work has identified roles for the Rho family guanine nucleotide exchange factors Trio and Vav3 in glioblastoma invasion. Both Trio and Vav3 act on the small GTPase RhoG. We therefore examined the role of RhoG in the invasive behavior of glioblastoma cells.
Results: We found that siRNA-mediated depletion of RhoG strongly inhibits invasion of glioblastoma cells through brain slices ex vivo. In addition, depletion of RhoG has a marginal effect on glioblastoma cell proliferation, but significantly inhibits glioblastoma cell survival in colony formation assays. We also observed that RhoG is activated by both HGF and EGF, two factors that are thought to be clinically relevant drivers of glioblastoma invasive behavior, and that RhoG is overexpressed in human glioblastoma tumors versus non-neoplastic brain. In search of a mechanism for the contribution of RhoG to the malignant behavior of glioblastoma cells, we found that depletion of RhoG strongly inhibits activation of the Rac1 GTPase by both HGF and EGF. In line with this observation, we also show that RhoG contributes to the formation of lamellipodia and invadopodia, two functions that have been shown to be Rac1-dependent.
Conclusions: Our functional analysis of RhoG in the context of glioblastoma revealed a critical role for RhoG in tumor cell invasion and survival. These results suggest that targeting RhoG-mediated signaling presents a novel avenue for glioblastoma therapy.
Figures
Figure 1
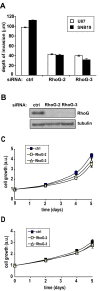
RhoG is necessary for glioblastoma cell invasion. A) Brain slice invasion assay. GFP-expressing SNB19 and U87 glioblastoma cells were transfected with siRNAs (10 nM) directed against luciferase (control) or RhoG (two different oligos). The brain slice invasion assay was performed as described in Materials and Methods. Shown are the mean (+/−SEM) of three independent experiments, each performed in triplicate. Differences between RhoG knockdown and control are significant (p < 0.001, two-tailed t test). B) Western blot demonstrating depletion of RhoG in SNB19 cells. C and D) Depletion of RhoG has only a marginal inhibitory effect on cell proliferation. SNB19 cells were transfected with siRNAs (10 nM) directed against luciferase (control, solid squares) or RhoG (RhoG-2, empty squares; RhoG-3, empty triangles). Cell proliferation was quantified using the Sulphorhodamine B assay as described in Materials and Methods, either in the presence of 10% FBS (C) or in the absence of serum (D). Results shown represent the mean +/− SEM for respectively 6 independent experiments (C) and 4 independent experiments (D).
Figure 2
RhoG mediates HGF-induced Rac1 activation. A) Time-dependence of RhoG activation by HGF. SNB19 cells were serum starved for 24 hours, and incubated further with or without HGF for the indicated time. Subsequently, cells were lysed and RhoG activity was determined using an active RhoG pull down assay as detailed in Materials and Methods. Western blot shows activated RhoG and total RhoG for HGF (25 ng/ml)-stimulated and control cells. Histogram shows quantification (+/− SEM) of at least 5 independent experiments. B) RhoG mediates HGF-induced Rac activation. Cells were transfected with siRNAs (10 nM) directed against luciferase (control) or RhoG-2. Forty eight hours after transfection, cells were serum starved for 24 hours, and incubated further with or without HGF for the indicated time periods. Rac activity was determined using the Rac G-LISA Activation Assay as detailed in Materials and Methods. The results shown represent the means +/− SEM of at least 3 independent experiments (* = p < 0.05, two-tailed t test). C) depletion of RhoG does not affect expression of Rac1 nor vice versa. Cells were transfected with siRNAs (10 nM) directed against luciferase (control) or RhoG (two different oligos). Cells were lysed 72 hours after transfection, followed by western blot analysis. Histograms shows quantification (+/− SEM) of between 3 and 4 independent experiments.
Figure 3
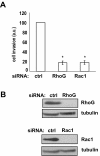
RhoG mediates HGF-induced invasion. A) SNB19 glioblastoma cells were transfected with siRNAs directed against luciferase (control, 20 nM), RhoG-2 (10 nM) or Rac1-1 (20 nM). Two days after transfection, cells were serum starved overnight and processed for the Matrigel invasion assay as described in Materials and Methods. All invaded cells on the bottom of the filter were counted using an inverted microscope. Data were normalized to those of control cells. The results shown represent the means +/− SEM of 4 independent experiments, performed in duplicate (* = p < 0.0005, two-tailed t test). B) Western blot demonstrating depletion of RhoG and Rac1.
Figure 4
Rac1-mediated invasion depends on a threshold of Rac1 expression. A) Rac1 siRNA-concentration dependence of cell invasion. SNB19 cells were transfected with the indicated Rac1 siRNA concentrations and invasion assays were performed as in Figure 3. The results shown represent the means +/− SEM of 4 independent experiments, performed in duplicate. Data were normalized to those of control cells. B) Rac1 siRNA-concentration dependence of Rac1 activation state. Cells were transfected with the indicated Rac1 siRNA concentrations and Rac activity was determined as in Figure 2B. The results shown represent the means +/− SEM of 5 independent experiments. C and D) Rac1 siRNA-concentration dependence of Rac1 expression. C) Representative western blot demonstrating siRNA-dependent depletion of Rac1. D) Quantification of western blots for experiments shown in A) and B). The results shown represent the means +/− SEM of 8 independent experiments. Data were normalized to those of control cells.
Figure 5
RhoG is necessary for the formation of lamellipodia and invadopodia. A) Fluorescence micrographs illustrating the effects of knockdown of RhoG and Rac1 on the formation of lamellipodia and ruffles. SNB19 glioblastoma cells were transfected with siRNAs directed against luciferase (control, 20 nM), RhoG-2 (10 nM) or Rac1 (20 nM). Two days after transfection, cells were plated on laminin-coated coverslips and serum starved overnight. Subsequently, cells were incubated with DMEM (untreated) or stimulated 4 min with DMEM containing 25 ng/ml HGF and processed as described in Materials and Methods. Scale bar represents 10 μm. Lamellipodia are indicated by an arrowhead. Ruffles are indicated by arrows. B) Quantification of lamellipodia and ruffle formation. Presented are mean values (+/− SEM) for approximately 35 cells per condition. The results shown are representative of two independent experiments. C) RhoG is necessary for invadopodia formation. SNB19 cells were transfected with siRNA (20 nM) directed against luciferase (control), RhoG-2 or Rac1-1. Forty eight hours after transfection, cells were split to a new dish for another 24 hours prior to plating on FITC-gelatin coated coverslips for 16 to 18 hours. Invadopodia formation was determined as described in Materials and Methods. For each condition, 16 (60x) fields were quantified, comprising a total of approximately 30 cells. The results shown represent the means +/− SEM of 5 independent experiments (*p < 0.05 and **p < 0.0005, two-tailed t test).
Figure 6
RhoG mediates EGF-induced Rac1 activation. A) RhoG is activated by EGF (50 ng/ml) in SNB19 cells. Western blot shows activated RhoG and total RhoG for HGF-stimulated and controls cells. Histogram shows quantification (+/− SEM) of 5 independent experiments (p < 0.05, two-tailed t test). B) RhoG mediates EGF-induced Rac activation. Cells were transfected with siRNAs (10 nM) directed against luciferase (control) or RhoG-2. Forty eight hours after transfection, cells were serum starved for 24 hours, and incubated further with or without EGF for the indicated time periods. Rac activity was determined as in Figure 2B. The results shown represent the means +/− SEM of 3 independent experiments (* = p < 0.05, two-tailed t test).
Figure 7
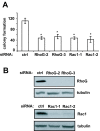
RhoG and Rac1 contribute to glioblastoma cell clonogenicity. A) Colony formation assay. SNB19 cells were transfected with siRNAs (10 nM) directed against luciferase (control), RhoG or Rac1. Colony formation assays were performed as described in Materials and Methods. The results shown represent the means +/− SEM of 4 independent experiments (each performed in quadruplet dishes) for the RhoG and 3 independent experiments for the Rac1 knock-downs (p < 0.001, two-tailed t test). B) Western blot demonstrating depletion of RhoG and Rac1.
Figure 8
RhoG is strongly expressed in glioblastoma tumors. A) Representative RhoG immunohistochemistry micrograph of reactive tissue adjacent to tumor. “V” indicates vessel, arrows indicate normal glial cells and arrowheads point to reactive astrocytes in the tumor rim. B) Representative RhoG immunohistochemistry micrograph of tumor core. Scale bar represents 100 μm.
Similar articles
- Guanine nucleotide exchange factor Dock7 mediates HGF-induced glioblastoma cell invasion via Rac activation.
Murray DW, Didier S, Chan A, Paulino V, Van Aelst L, Ruggieri R, Tran NL, Byrne AT, Symons M. Murray DW, et al. Br J Cancer. 2014 Mar 4;110(5):1307-15. doi: 10.1038/bjc.2014.39. Epub 2014 Feb 11. Br J Cancer. 2014. PMID: 24518591 Free PMC article. - The Role of Rho GTPases in Motility and Invasion of Glioblastoma Cells.
Al-Koussa H, Atat OE, Jaafar L, Tashjian H, El-Sibai M. Al-Koussa H, et al. Anal Cell Pathol (Amst). 2020 Jan 31;2020:9274016. doi: 10.1155/2020/9274016. eCollection 2020. Anal Cell Pathol (Amst). 2020. PMID: 32089990 Free PMC article. Review. - Cdc42 and the guanine nucleotide exchange factors Ect2 and trio mediate Fn14-induced migration and invasion of glioblastoma cells.
Fortin SP, Ennis MJ, Schumacher CA, Zylstra-Diegel CR, Williams BO, Ross JT, Winkles JA, Loftus JC, Symons MH, Tran NL. Fortin SP, et al. Mol Cancer Res. 2012 Jul;10(7):958-68. doi: 10.1158/1541-7786.MCR-11-0616. Epub 2012 May 9. Mol Cancer Res. 2012. PMID: 22571869 Free PMC article. - An Experimenter's Guide to Glioblastoma Invasion Pathways.
de Gooijer MC, Guillén Navarro M, Bernards R, Wurdinger T, van Tellingen O. de Gooijer MC, et al. Trends Mol Med. 2018 Sep;24(9):763-780. doi: 10.1016/j.molmed.2018.07.003. Epub 2018 Jul 30. Trends Mol Med. 2018. PMID: 30072121 Review.
Cited by
- Systematic review of protein biomarkers of invasive behavior in glioblastoma.
Sayegh ET, Kaur G, Bloch O, Parsa AT. Sayegh ET, et al. Mol Neurobiol. 2014 Jun;49(3):1212-44. doi: 10.1007/s12035-013-8593-5. Epub 2013 Nov 24. Mol Neurobiol. 2014. PMID: 24271659 Review. - Importance of RhoGTPases in formation, characteristics, and functions of invadosomes.
Spuul P, Ciufici P, Veillat V, Leclercq A, Daubon T, Kramer IJ, Génot E. Spuul P, et al. Small GTPases. 2014;5:e28195. doi: 10.4161/sgtp.28713. Epub 2014 May 8. Small GTPases. 2014. PMID: 24967648 Free PMC article. Review. - Non-apoptotic cell death associated with perturbations of macropinocytosis.
Maltese WA, Overmeyer JH. Maltese WA, et al. Front Physiol. 2015 Feb 16;6:38. doi: 10.3389/fphys.2015.00038. eCollection 2015. Front Physiol. 2015. PMID: 25762935 Free PMC article. Review. - Proteomics reveals differentially regulated pathways when comparing grade 2 and 4 astrocytomas.
Verissimo DCA, Camillo-Andrade AC, Santos MDM, Sprengel SL, Zanine SC, Borba LAB, Carvalho PC, da G Fischer JS. Verissimo DCA, et al. PLoS One. 2023 Nov 15;18(11):e0290087. doi: 10.1371/journal.pone.0290087. eCollection 2023. PLoS One. 2023. PMID: 37967105 Free PMC article. - A Trio-Rac1-Pak1 signalling axis drives invadopodia disassembly.
Moshfegh Y, Bravo-Cordero JJ, Miskolci V, Condeelis J, Hodgson L. Moshfegh Y, et al. Nat Cell Biol. 2014 Jun;16(6):574-86. doi: 10.1038/ncb2972. Epub 2014 May 25. Nat Cell Biol. 2014. PMID: 24859002 Free PMC article.
References
- Karlsson R, Pedersen ED, Wang Z, Brakebusch C. Rho GTPase function in tumorigenesis. Biochim Biophys Acta. 2009;1796:91–98. - PubMed
- Stupp R, Hegi ME, Mason WP, van den Bent MJ, Taphoorn MJ, Janzer RC. et al.Effects of radiotherapy with concomitant and adjuvant temozolomide versus radiotherapy alone on survival in glioblastoma in a randomised phase III study: 5-year analysis of the EORTC-NCIC trial. Lancet Oncol. 2009;10:459–466. doi: 10.1016/S1470-2045(09)70025-7. - DOI - PubMed
Publication types
MeSH terms
Substances
LinkOut - more resources
Full Text Sources
Other Literature Sources
Medical
Research Materials


