Evaluation of candidate biomarkers to predict cancer cell sensitivity or resistance to PARP-1 inhibitor treatment - PubMed (original) (raw)
. 2012 Oct 15;11(20):3837-50.
doi: 10.4161/cc.22026. Epub 2012 Sep 14.
Kamila Wolanin, Martin Mistrik, Gabriela Korinkova, Dana Simkova, Jan Bouchal, Rene Lenobel, Jirina Bartkova, Alan Lau, Mark J O'Connor, Jiri Lukas, Jiri Bartek
Affiliations
- PMID: 22983061
- PMCID: PMC3495826
- DOI: 10.4161/cc.22026
Evaluation of candidate biomarkers to predict cancer cell sensitivity or resistance to PARP-1 inhibitor treatment
Lenka Oplustilova et al. Cell Cycle. 2012.
Abstract
Impaired DNA damage response pathways may create vulnerabilities of cancer cells that can be exploited therapeutically. One such selective vulnerability is the sensitivity of BRCA1- or BRCA2-defective tumors (hence defective in DNA repair by homologous recombination, HR) to inhibitors of the poly(ADP-ribose) polymerase-1 (PARP-1), an enzyme critical for repair pathways alternative to HR. While promising, treatment with PARP-1 inhibitors (PARP-1i) faces some hurdles, including (1) acquired resistance, (2) search for other sensitizing, non-BRCA1/2 cancer defects and (3) lack of biomarkers to predict response to PARP-1i. Here we addressed these issues using PARP-1i on 20 human cell lines from carcinomas of the breast, prostate, colon, pancreas and ovary. Aberrations of the Mre11-Rad50-Nbs1 (MRN) complex sensitized cancer cells to PARP-1i, while p53 status was less predictive, even in response to PARP-1i combinations with camptothecin or ionizing radiation. Furthermore, monitoring PARsylation and Rad51 foci formation as surrogate markers for PARP activity and HR, respectively, supported their candidacy for biomarkers of PARP-1i responses. As to resistance mechanisms, we confirmed the role of the multidrug resistance efflux transporters and its reversibility. More importantly, we demonstrated that shRNA lentivirus-mediated depletion of 53BP1 in human BRCA1-mutant breast cancer cells increased their resistance to PARP-1i. Given the preferential loss of 53BP1 in BRCA-defective and triple-negative breast carcinomas, our findings warrant assessment of 53BP1 among candidate predictive biomarkers of response to PARPi. Overall, this study helps characterize genetic and functional determinants of cellular responses to PARP-1i and contributes to the search for biomarkers to exploit PARP inhibitors in cancer therapy.
Figures
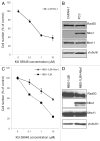
Figure 1. Human Nbs1-deficient fibroblasts NBS-1LBI and pancreatic cancer cell line CAPAN-1 are highly sensitive to KU 58948. (A) Cell survival curve of CAPAN-1 cells upon PARP-1i treatment. After 4 d (see Methods), cell numbers were counted and expressed as percentage of untreated control cells. Results are means ± s.d. (B) Western blot analysis of Mre11-Rad50-Nbs1 complex proteins shows deficiency of Nbs1 in CAPAN-1 cells; γ-tubulin was used as a loading control. (C) Proliferation curves of Nbs1-deficient NBS-1LBI and isogenic Nbs1-wt complemented NBS-1LBI+Nbs1 human fibroblasts in response to PARP-1i. Results are means ± s.d. (D) Western blot analysis of MRN complex proteins showing selective Nbs1 protein defect in NBS-1LBI and re-expression of Nbs1-wt protein NBS-1LBI+Nbs1; γ-tubulin served as a loading control.
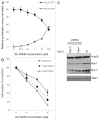
Figure 2. Deficiency in the MRN complex sensitizes breast cancer cells to PARP-1i. (A) Proliferation activity of Cal51-wt cells measured by XTT test after 4 d treatment with KU 58948 and complemented with the cell death assessment performed by LDH activity measurement from the same cells. Results represent means ± s.d. (B) Survival curves of Cal51 MRN-wt, Nbs1 and Mre11 knockdown cells upon 2-d treatment with KU 58948 followed by 2 d growth in DMEM. (C) Western blot analysis of Cal51 breast cancer cell line expressing wt-MRN complex and stable shRNA mediated knockdown of Nbs1 and Mre11. Detection of SMC1 was used as a loading control.
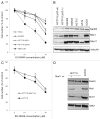
Figure 3. MRN defect does not cause marked sensitivity of colon cancer cells to PARP-1 inhibitor in a short-term assay. (A) Proliferation curves of MRN-proficient (SW620) colon cancer cell line or deficient in Nbs1 (HT29) and Mre11 proteins (HCT116 p53-wt, HCT116 p53-deleted), respectively. NBS-1LBI was used as a sensitive cell line to compare the response of colon cancer cells. Cells were exposed to a range of concentrations of PARP-1 inhibitor for 2 d, split and grown for additional 2 d in DMEM only. Proliferation activity was determined by cell counting and is expressed as a percentage of control cells. Results represent means ± s.d. (B) MRN complex protein expression is normal in osteosarcoma U2OS cells and SW620, SW480 and HCT15 colon cancer cell lines while HCT116 colon cancer cells show low levels of endogenous wild type Mre11 and expresses a shorter dominant-negative splice variant of Mre11 (Wen et al., 2008) with a strong impact on total abundance of the MRN complex. HT29 cells show deficiencies of Nbs1 and Mre11 proteins. (C) Survival curves of MRN deficient and Mre11-wt reconstituted HCT116 (p53-wt) cells upon the standard treatment with PARP-1 inhibitor. Results represent means ± s.d. (D) MRN protein expression in wild-type SW620 cells and HCT116 (p53-wt) cells with/ without Mre11-wt transfection. The same membrane was also blotted for SMC1 as a protein loading control.
Figure 4. Combination of KU 58948 and P-gp inhibitor Verapamil decreases survival of MRN-deficient colon cancer cells. HCT116 cells were treated with KU 58948 in concentrations 10−8 – 10−4 M or pre-treated for 1 h with 5 μg/ ml Verapamil prior to addition of KU 58948. The cells were grown for 4 d and subsequently the cell viability was assessed using the XTT test.
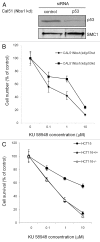
Figure 5. Effect of p53 status on sensitivity of MRN-deficient colon and breast cancer cell lines. (A) Wild-type p53 protein was transiently silenced by RNA interference in Cal51 (Nbs1 knockdown) cell line as shown by western blotting. SMC1 protein was used to verify equal protein loading. (B) Proliferation curves represent sensitivity of Cal51 (Nbs1 knockdown) cell line possessing either wild-type or silenced p53 protein to PARP-1 inhibitor treatment. (C) Evaluation of sensitivity of MRN-deficient HCT116 p53 wt and p53-null and MRN-proficient HCT15 colon cancer cells to PARP-1 inhibitor treatment in 12-d colony-forming assay.
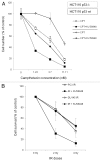
Figure 6. Combined treatment with KU 58948 and camptothecin or irradiation effectively reduces cell survival. (A) Proliferation curves of HCT116 p53-wt and HCT116 p53- deficient cells treated with various concentrations of CPT alone or combined and 1 μM KU 58948. After 2-d exposure to the drugs, cells were split and grown for additional 2 d in DMEM only. Proliferation activity was determined by cell counting and is expressed as a percentage of untreated control cells. Results are means ± s.d. (B) Evaluation of sensitivity of prostate cancer cell lines PC3 and DU145 to KU 58948 alone or in combination with irradiation in a 12-d colony-forming assay. Results are means ± s.d.
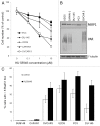
Figure 7. Correlation between spontaneous PARsylation, Rad51 foci formation and sensitivity to PARP-1 inhibitor. (A) Sensitivity of different osteosarcoma, pancreatic, prostate and ovarian cancer cell lines to PARP-1 inhibitor in a short-term (4 d) proliferation assay. (B) Western blot results showing expression of spontaneous PAR in tested cell lines. (C) Rad51 foci induction after 24 h treatment with 1 μM KU 58948 (data represent the average of two independent experiments).
Figure 8. Downregulation of 53BP1 protein leads to increased resistance to PARP-1 inhibitors of human BRCA1-deficient cancer cells MDA-MB-436. (A) Cell survival curve of the MDA-MB-436 and Cal51 cell line upon 53BP1 downregulation and PARP-1 inhibitor treatment. MDA-MB-436 cell line is BRCA1 deficient, whereas Cal 51 cell line was used as control cell line expressing BRCA1 protein. Cells were seeded in triplicates and exposed to 0.1 and 1.0 µM olaparib (or vehiculum) for a period of time corresponding to four cell cycles. Surviving fraction (SF) was determined by cell counting and compared with untreated cells. Results are means ± s.d. (B) Western blot analysis of BRCA1 and 53BP1proteins after stable shRNA mediated downregulation. SMC1 was used as a protein loading control. (C) Heterogeneity of shRNA mediated 53BP1 downregulation in MDA-MB-436 (lower panel; control is shown in the upper panel). (D) Heteregeneity of 53BP1 staining in different breast cancer patients. Empty arrows show positivity in stromal cells, bold arrows indicate different staining intensity of cancer cells (40× magnification in the upper panels and 100× in the lower ones).
Comment in
- Addicted to PAR? A closer look at PARP inhibitor sensitivity.
Altmeyer M. Altmeyer M. Cell Cycle. 2012 Nov 1;11(21):3916. doi: 10.4161/cc.22393. Epub 2012 Oct 3. Cell Cycle. 2012. PMID: 23032267 Free PMC article. No abstract available. - Predicting PARP inhibitor sensitivity and resistance.
Bebb DG, Lees-Miller SP. Bebb DG, et al. Cell Cycle. 2012 Nov 15;11(22):4110. doi: 10.4161/cc.22604. Epub 2012 Oct 25. Cell Cycle. 2012. PMID: 23099922 Free PMC article. No abstract available.
Similar articles
- Stabilization of mutant BRCA1 protein confers PARP inhibitor and platinum resistance.
Johnson N, Johnson SF, Yao W, Li YC, Choi YE, Bernhardy AJ, Wang Y, Capelletti M, Sarosiek KA, Moreau LA, Chowdhury D, Wickramanayake A, Harrell MI, Liu JF, D'Andrea AD, Miron A, Swisher EM, Shapiro GI. Johnson N, et al. Proc Natl Acad Sci U S A. 2013 Oct 15;110(42):17041-6. doi: 10.1073/pnas.1305170110. Epub 2013 Oct 1. Proc Natl Acad Sci U S A. 2013. PMID: 24085845 Free PMC article. - RAD51 foci as a functional biomarker of homologous recombination repair and PARP inhibitor resistance in germline BRCA-mutated breast cancer.
Cruz C, Castroviejo-Bermejo M, Gutiérrez-Enríquez S, Llop-Guevara A, Ibrahim YH, Gris-Oliver A, Bonache S, Morancho B, Bruna A, Rueda OM, Lai Z, Polanska UM, Jones GN, Kristel P, de Bustos L, Guzman M, Rodríguez O, Grueso J, Montalban G, Caratú G, Mancuso F, Fasani R, Jiménez J, Howat WJ, Dougherty B, Vivancos A, Nuciforo P, Serres-Créixams X, Rubio IT, Oaknin A, Cadogan E, Barrett JC, Caldas C, Baselga J, Saura C, Cortés J, Arribas J, Jonkers J, Díez O, O'Connor MJ, Balmaña J, Serra V. Cruz C, et al. Ann Oncol. 2018 May 1;29(5):1203-1210. doi: 10.1093/annonc/mdy099. Ann Oncol. 2018. PMID: 29635390 Free PMC article. - Effect of MRE11 loss on PARP-inhibitor sensitivity in endometrial cancer in vitro.
Koppensteiner R, Samartzis EP, Noske A, von Teichman A, Dedes I, Gwerder M, Imesch P, Ikenberg K, Moch H, Fink D, Stucki M, Dedes KJ. Koppensteiner R, et al. PLoS One. 2014 Jun 13;9(6):e100041. doi: 10.1371/journal.pone.0100041. eCollection 2014. PLoS One. 2014. PMID: 24927325 Free PMC article. - Use of poly ADP-ribose polymerase [PARP] inhibitors in cancer cells bearing DDR defects: the rationale for their inclusion in the clinic.
Cerrato A, Morra F, Celetti A. Cerrato A, et al. J Exp Clin Cancer Res. 2016 Nov 24;35(1):179. doi: 10.1186/s13046-016-0456-2. J Exp Clin Cancer Res. 2016. PMID: 27884198 Free PMC article. Review. - Therapeutic Application of PARP Inhibitors in Neuro-Oncology.
Ning J, Wakimoto H. Ning J, et al. Trends Cancer. 2020 Feb;6(2):147-159. doi: 10.1016/j.trecan.2019.12.004. Epub 2020 Jan 13. Trends Cancer. 2020. PMID: 32061304 Review.
Cited by
- Molecular mechanism of PARP inhibitor resistance.
Huang Y, Chen S, Yao N, Lin S, Zhang J, Xu C, Wu C, Chen G, Zhou D. Huang Y, et al. Oncoscience. 2024 Sep 23;11:69-91. doi: 10.18632/oncoscience.610. eCollection 2024. Oncoscience. 2024. PMID: 39318358 Free PMC article. Review. - PTEN inhibition enhances sensitivity of ovarian cancer cells to the poly (ADP-ribose) polymerase inhibitor by suppressing the MRE11-RAD50-NBN complex.
Qiu L, Li R, Wang Y, Lu Z, Tu Z, Liu H. Qiu L, et al. Br J Cancer. 2024 Aug;131(3):577-588. doi: 10.1038/s41416-024-02749-w. Epub 2024 Jun 12. Br J Cancer. 2024. PMID: 38866962 - Co-Packaged PARP inhibitor and photosensitizer for targeted photo-chemotherapy of 3D ovarian cancer spheroids.
Sorrin A, Dasgupta A, McNaughton K, Arnau Del Valle C, Zhou K, Liu C, Roque DM, Huang HC. Sorrin A, et al. Cell Biosci. 2024 Feb 6;14(1):20. doi: 10.1186/s13578-024-01197-6. Cell Biosci. 2024. PMID: 38321470 Free PMC article. - Mechanisms of PARP Inhibitor Resistance.
O'Connor MJ, Forment JV. O'Connor MJ, et al. Cancer Treat Res. 2023;186:25-42. doi: 10.1007/978-3-031-30065-3_3. Cancer Treat Res. 2023. PMID: 37978129 - An activity-based functional test for identifying homologous recombination deficiencies across cancer types in real time.
Lee CY, Cheng WF, Lin PH, Chen YL, Huang SH, Lei KH, Chang KY, Ko MY, Chi P. Lee CY, et al. Cell Rep Med. 2023 Nov 21;4(11):101247. doi: 10.1016/j.xcrm.2023.101247. Epub 2023 Oct 19. Cell Rep Med. 2023. PMID: 37863059 Free PMC article.
References
Publication types
MeSH terms
Substances
LinkOut - more resources
Full Text Sources
Other Literature Sources
Research Materials
Miscellaneous
