Losing the struggle to stay awake: divergent thalamic and cortical activity during microsleeps - PubMed (original) (raw)
Losing the struggle to stay awake: divergent thalamic and cortical activity during microsleeps
Govinda R Poudel et al. Hum Brain Mapp. 2014 Jan.
Abstract
Maintaining alertness is critical for safe and successful performance of most human activities. Consequently, microsleeps during continuous visuomotor tasks, such as driving, can be very serious, not only disrupting performance but sometimes leading to injury or death due to accidents. We have investigated the neural activity underlying behavioral microsleeps--brief (0.5-15 s) episodes of complete failure to respond accompanied by slow eye-closures--and EEG theta activity during drowsiness in a continuous task. Twenty healthy normally-rested participants performed a 50-min continuous tracking task while fMRI, EEG, eye-video, and responses were simultaneously recorded. Visual rating of performance and eye-video revealed that 70% of the participants had frequent microsleeps. fMRI analysis revealed a transient decrease in thalamic, posterior cingulate, and occipital cortex activity and an increase in frontal, posterior parietal, and parahippocampal activity during microsleeps. The transient activity was modulated by the duration of the microsleep. In subjects with frequent microsleeps, power in the post-central EEG theta was positively correlated with the BOLD signal in the thalamus, basal forebrain, and visual, posterior parietal, and prefrontal cortices. These results provide evidence for distinct neural changes associated with microsleeps and with EEG theta activity during drowsiness in a continuous task. They also suggest that the occurrence of microsleeps during an active task is not a global deactivation process but involves localized activation of fronto-parietal cortex, which, despite a transient loss of arousal, may constitute a mechanism by which these regions try to restore responsiveness.
Keywords: EEG; drowsiness; fMRI; microsleeps; visuomotor tracking.
Copyright © 2012 Wiley Periodicals, Inc.
Figures
Figure 1
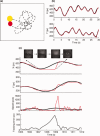
Tracking task and eyelid and response behaviour associated with a typical microsleep during the tracking task. (a) Participants used a finger‐based joystick to track the displayed yellow target disc moving in a quasi‐random trajectory (dotted line) with a red cursor disc. (b) Accurate tracking led to the movement of the response disc along the same trajectory as the target disc as displayed in the target (smooth black line) and response (jerky red line) position for one cycle (30‐s) of tracking. (c) Tracking response (jerky red line) is flat in both directions (leading to an increase in tracking error and zero speed) and eyes slowly close during a typical microsleep. The units are in pixels (px). [Color figure can be viewed in the online issue, which is available at
.]
Figure 2
Number and median duration of microsleeps (BMs) in the 20 participants during 50 min of tracking.
Figure 3
Per minute estimates of percentage time spent in microsleeps (PERBM), percentage time with greater than 80% eye closure (PERCLOS), relative theta power at Pz, and tracking error in three representative participants. The top panel depicts PERBM in the participant with highest number (190) of microsleeps (I) and a participant with a moderate number (77) of microsleeps (II). The middle panel depicts tracking error (thin line) and PERCLOS (thick line) in the same two participants plus a participant with no microsleeps (III). The bottom panel depicts tracking error (thin line) and relative theta power (thick line) in the same participants. Pearson correlations (r) between time‐courses are displayed within each panel. [Color figure can be viewed in the online issue, which is available at
.]
Figure 4
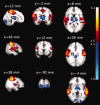
Group‐level significant (Z > 4.5, P < 0.01, family‐wise‐error corrected) pattern of activation (Red‐yellow) and deactivation (blue‐light blue) during microsleeps are shown overlaid on average structural slices. The group‐level pattern was obtained from the 14 participants with frequent microsleeps. The slices are presented in radiological convention and labeled with MNI coordinates. [Color figure can be viewed in the online issue, which is available at
.]
Figure 5
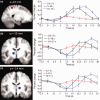
The BOLD signal modulated by duration in the (a) right superior parietal cortex (MNI coordinates (mm): 22, −44, 58), (b) right thalamus (MNI coordinates (mm): 14, −10, 4), and (c) left thalamus (−14, −14, 4). Average BOLD signal time‐course for three different duration microsleeps bins (0.5–5 s, 5–10 s, and 10–15 s) are shown. The time‐courses were obtained from the eight participants who had microsleeps in all three duration bins. The vertical bars represent the standard error of the mean across subjects (N = 8). The onset of microsleeps is at time zero. Note that both activation and deactivation signals mirror the duration of microsleeps. [Color figure can be viewed in the online issue, which is available at
.]
Figure 6
Group‐level statistical maps showing positive correlation (P < 0.05, family‐wise‐error corrected) between BOLD and theta activity (average of P1, P2, and Pz) in individuals with frequent microsleeps. The group‐level pattern was obtained from the 10 participants with frequent microsleeps and electrode impedance <15 kΩ. The axial slices are presented in radiological convention and labeled with MNI coordinates. [Color figure can be viewed in the online issue, which is available at
.]
Figure 7
Group‐level statistical maps showing negative correlation (P < 0.01, cluster‐extent of 50 voxels) between BOLD and spontaneous alpha activity (average of O1, O2, Oz) in individuals with frequent microsleeps. The group‐level pattern was obtained from the 10 participants with frequent microsleeps and electrode impedance <15 kΩ. The axial slices are presented in radiological convention and labeled with MNI coordinates. [Color figure can be viewed in the online issue, which is available at
.]
Similar articles
- Temporal evolution of neural activity and connectivity during microsleeps when rested and following sleep restriction.
Poudel GR, Innes CRH, Jones RD. Poudel GR, et al. Neuroimage. 2018 Jul 1;174:263-273. doi: 10.1016/j.neuroimage.2018.03.031. Epub 2018 Mar 16. Neuroimage. 2018. PMID: 29555427 - Time-varying effective connectivity of the cortical neuroelectric activity associated with behavioural microsleeps.
Toppi J, Astolfi L, Poudel GR, Innes CRH, Babiloni F, Jones RD. Toppi J, et al. Neuroimage. 2016 Jan 1;124(Pt A):421-432. doi: 10.1016/j.neuroimage.2015.08.059. Epub 2015 Sep 10. Neuroimage. 2016. PMID: 26363348 - Efficient and regular patterns of nighttime sleep are related to increased vulnerability to microsleeps following a single night of sleep restriction.
Innes CR, Poudel GR, Jones RD. Innes CR, et al. Chronobiol Int. 2013 Nov;30(9):1187-96. doi: 10.3109/07420528.2013.810222. Epub 2013 Sep 3. Chronobiol Int. 2013. PMID: 23998288 - The relationship between behavioural microsleeps, visuomotor performance and EEG theta.
Poudel GR, Innes CR, Bones PJ, Jones RD. Poudel GR, et al. Annu Int Conf IEEE Eng Med Biol Soc. 2010;2010:4452-5. doi: 10.1109/IEMBS.2010.5625956. Annu Int Conf IEEE Eng Med Biol Soc. 2010. PMID: 21095769 - The visual scoring of sleep and arousal in infants and children.
Grigg-Damberger M, Gozal D, Marcus CL, Quan SF, Rosen CL, Chervin RD, Wise M, Picchietti DL, Sheldon SH, Iber C. Grigg-Damberger M, et al. J Clin Sleep Med. 2007 Mar 15;3(2):201-40. J Clin Sleep Med. 2007. PMID: 17557427 Review.
Cited by
- Longitudinal single-subject neuroimaging study reveals effects of daily environmental, physiological, and lifestyle factors on functional brain connectivity.
Triana AM, Salmi J, Hayward NMEA, Saramäki J, Glerean E. Triana AM, et al. PLoS Biol. 2024 Oct 8;22(10):e3002797. doi: 10.1371/journal.pbio.3002797. eCollection 2024 Oct. PLoS Biol. 2024. PMID: 39378200 Free PMC article. - Conscious but not thinking-Mind-blanks during visuomotor tracking: An fMRI study of endogenous attention lapses.
Zaky MH, Shoorangiz R, Poudel GR, Yang L, Innes CRH, Jones RD. Zaky MH, et al. Hum Brain Mapp. 2024 Aug 1;45(11):e26781. doi: 10.1002/hbm.26781. Hum Brain Mapp. 2024. PMID: 39023172 Free PMC article. - Blink-related arousal network surges are shaped by cortical vigilance states.
Demiral S, Lildharrie C, Lin E, Benveniste H, Volkow N. Demiral S, et al. Res Sq [Preprint]. 2024 May 10:rs.3.rs-4271439. doi: 10.21203/rs.3.rs-4271439/v1. Res Sq. 2024. PMID: 38766129 Free PMC article. Preprint. - Homeostatic NREM sleep and salience network function in adult mice exposed to ethanol during development.
Shah P, Kaneria A, Fleming G, Williams CRO, Sullivan RM, Lemon CH, Smiley J, Saito M, Wilson DA. Shah P, et al. Front Neurosci. 2023 Nov 14;17:1267542. doi: 10.3389/fnins.2023.1267542. eCollection 2023. Front Neurosci. 2023. PMID: 38033546 Free PMC article. - Spotlight on Sleep Stage Classification Based on EEG.
Lambert I, Peter-Derex L. Lambert I, et al. Nat Sci Sleep. 2023 Jun 29;15:479-490. doi: 10.2147/NSS.S401270. eCollection 2023. Nat Sci Sleep. 2023. PMID: 37405208 Free PMC article.
References
- Allen PJ, Josephs O, Turner R (2000): A method for removing imaging artifact from continuous EEG recorded during functional MRI. Neuroimage 12:230–239. - PubMed
- Behrens TEJ, Johansen‐Berg H, Woolrich MW, Smith SM, Wheeler‐Kingshott CAM, Boulby PA, Barker GJ, Sillery EL, Sheehan K, Ciccarelli O (2003): Non‐invasive mapping of connections between human thalamus and cortex using diffusion imaging. Nat Neurosci 6:750–757. - PubMed
- Briselli E, Garreffa G, Bianchi L, Bianciardi M, Macaluso E, Abbafati M, Grazia Marciani M, Maraviglia B (2006): An independent component analysis‐based approach on ballistocardiogram artifact removing. Magn Reson Imaging 24:393–400. - PubMed
- Buchsbaum MS, Buchsbaum BR, Chokron S, Tang C, Wei TC, Byne W (2006): Thalamocortical circuits: fMRI assessment of the pulvinar and medial dorsal nucleus in normal volunteers. Neurosci Lett 404:282–287. - PubMed
Publication types
MeSH terms
LinkOut - more resources
Full Text Sources
Other Literature Sources


