Antibody-aided clearance of extracellular α-synuclein prevents cell-to-cell aggregate transmission - PubMed (original) (raw)
Antibody-aided clearance of extracellular α-synuclein prevents cell-to-cell aggregate transmission
Eun-Jin Bae et al. J Neurosci. 2012.
Abstract
Abnormal deposition and intercellular propagation of α-synuclein plays a central role in the pathogenesis of disorders such as Parkinson's Disease (PD) and dementia with Lewy bodies (DLB). Previous studies demonstrated that immunization against α-synuclein resulted in reduced α-synuclein accumulation and synaptic loss in a transgenic (tg) mouse model, highlighting the potential for immunotherapy. However, the mechanism by which immunization prevents synucleinopathy-associated deficits remains unknown. Here, we show that antibodies against α-synuclein specifically target and aid in clearance of extracellular α-synuclein proteins by microglia, thereby preventing their actions on neighboring cells. Antibody-assisted clearance occurs mainly in microglia through the Fcγ receptor, and not in neuronal cells or astrocytes. Stereotaxic administration of antibody into the brains of α-synuclein tg mice prevented neuron-to-astroglia transmission of α-synuclein and led to increased localization of α-synuclein and the antibody in microglia. Furthermore, passive immunization with α-synuclein antibody reduced neuronal and glial accumulation of α-synuclein and ameliorated neurodegeneration and behavioral deficits associated with α-synuclein overexpression. These findings provide an underlying mechanistic basis for immunotherapy for PD/DLB and suggest extracellular forms of α-synuclein as potential therapeutic targets.
Figures
Figure 1.
Characterization of α-synuclein fibrils and oligomers. A–F, EM images of fibrils (A), sonicated fibrils (B), and oligomers (C–F). Scale bars: A–C, 0.5 μm; D–F, 30 nm. G, Size exclusion chromatography of oligomers. Asterisk (7 ml fraction) indicates the oligomer fraction. Monomers are present in the 13–15 ml fractions. H, Silver-staining image of the SEC fractions. I, Western blot analysis of various forms of α-synuclein. M, monomer; F, fibril; O, oligomer; CM, conditioned medium of differentiated SH-SY5Y cells expressing α-synuclein.
Figure 2.
Effects of monoclonal antibodies on uptake of extracellular α-synuclein aggregates. A, Internalization of α-synuclein fibrils in the presence of the indicated monoclonal antibodies against α-synuclein or control IgG (−) in BV-2 microglia cells. α-synuclein fibrils (0.2 μ
m
) was pre-incubated with either 5 μg/ml of control IgG or antibodies against α-synuclein for 5 min at room temperature and treated to BV-2 cells for 5 min at 37°C. The amount of the internalized α-synuclein was analyzed by Western blotting. B, Amounts of internalized α-synuclein were quantified and normalized by the levels of β-actin. Numbers in the _y_-axis represent the amounts of α-synuclein relative to the control. n = 4, *p < 0.05. C, Antibody dose-dependent uptake of α-synuclein fibrils (n = 3, p < 0.05) *, 274; #, 169.
Figure 3.
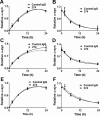
Effects of the 274 antibody on uptake and degradation of extracellular α-synuclein in microglia. A–D, Rates of uptake (A, C) and degradation (B, D) of α-synuclein fibrils (A, B) and oligomers (C, D) in BV-2 cells. Internalized α-synuclein aggregates were analyzed by Western blotting at the indicated times. Graphs in A and C indicate the amounts of α-synuclein relative to the maximum internalized levels with control IgG. Graphs in B and D indicate the amounts of α-synuclein remaining relative to those at time 0. All values were normalized to β-actin. Curves in each graph are significantly different (n = 4, p < 0.05). E, F, Effects of the 274 antibody on uptake of neuron-released α-synuclein in primary microglia. E, Primary rat microglia were treated with conditioned medium containing α-synuclein released from differentiated SH-SY5Y cells in the presence of control IgG or 274 antibody. F, Quantitative analysis of the data in E. Curves are significantly different (p < 0.05, n = 3). Control blot: β-tubulin.
Figure 4.
Lack of effects of the 274 antibody on uptake and degradation of α-synuclein fibrils in primary astrocytes and neuronal cells. A, B, Primary astrocyte (n = 4). C, D, Primary cortical neuron (n = 3). E, F, Differentiated SH-SY5Y cell (n = 4). A, C, E, Uptake rates. Graphs indicate the amounts of α-synuclein relative to the maximum internalized levels with control IgG. B, D, F, Degradation rates. Graphs indicate the amounts of α-synuclein remaining relative to those at time 0. Pre-incubation time with α-synuclein fibrils is 12 h (B, D, F). All the α-synuclein data were normalized with β-actin data. Curves in graphs are not significantly different.
Figure 5.
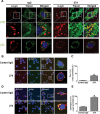
Role of Fcγ receptors in uptake of α-synuclein-antibody immune complex. A, Effects of Fcγ receptor blocking antibodies on the internalization of α-synuclein oligomers in BV-2 cells. Internalized α-synuclein oligomers were analyzed by Western blot, and values were normalized to β-actin. The _y_-axis of the graph indicates the amounts of α-synuclein relative to the maximum internalized level with control IgG. The red curve is significantly different from the others (n = 7, p < 0.05). B, Immunofluorescence imaging of Fcγ receptors and α-synuclein. Arrowheads indicate cells showing colocalization of α-synuclein and Fcγ receptors on the surface of cells. Scale bars: 20 μm. C, Expression of Fcγ receptor in various cell types. For BV-2, rat microglia, and rat astrocytes, an anti-CD16/CD32 antibody that is specific to rodent species was used, whereas for SH-SY5Y, an anti-CD32 antibody specific to the human protein was used. Note that expression of CD32 has not been reported in neurons in the brain in the previous studies. Red, Fcγ receptor; blue, nucleus. Scale bars: 20 μm. D, Internalization of antibodies into BV-2 cells in the presence of different amounts of α-synuclein fibrils or β-synuclein (0–330 n
m
). Internalized antibodies were analyzed with anti-mouse IgG antibody. The bottom panels are β-actin. E, Immunofluorescence microscopy of internalized α-synuclein fibrils and antibodies in BV-2 cells. Scale bars: 20 μm. F, Fluorescence from the internalized antibodies in E was quantified. One hundred and fifty cells were analyzed from three independent experiments (50 cells per each experiment). *p < 0.0001.
Figure 6.
Altered intracellular trafficking of internalized α-synuclein aggregates and increased delivery to lysosomes. A, Altered intracellular trafficking of internalized α-synuclein fibrils in BV-2 cells. The fluorescence-labeled tracers were treated to BV-2 microglia cells with either control IgG–α-synuclein mixture or α-synuclein–274 immune complex for 5 min at 37°C. Arrows indicate colocalization between α-synuclein and CTB in the presence of the 274 antibody. Scale bars: 5 μm. B–E, Localization of internalized α-synuclein aggregates in the endocytic compartments. The immune complexes were treated to BV-2 cells for 5 min. C, E, The number of α-synuclein puncta colocalized with caveolin-1 (C) and cathepsin D (E) was quantified. Three thousand puncta were analyzed from three independent experiments (1000 puncta per each experiment). Scale bars: 5 μm. *p < 0.005.
Figure 7.
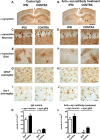
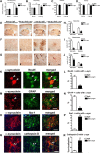
Reduced neuron-to-astrocyte transfer of α-synuclein in vivo after unilateral injection of the 274 antibody. A, B, Low-power (20×) view of the cortex and hippocampus of PDGF-α-synuclein tg mice (line M) comparing patterns of α-synuclein immunoreactivity. Scale bar: 200 μm. C–J, Higher power view (200×) of the hippocampus CA1 region showing α-synuclein accumulation in neurons (C, D) and the dentate gyrus region (E–J) showing α-synuclein accumulation in glial cells (E, F), the presence of GFAP astroglial cells (G, H), and the presence of Iba1 microglial cells (I, J). Scale bar: 25 μm. K, L, Image analysis of the numbers of α-synuclein-positive neurons and glial cells. n = 8 per group, 9 months old. *p < 0.01 by two-tailed Student's t test, unpaired.
Figure 8.
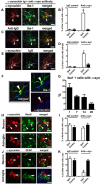
Increased localization of α-synuclein and IgG in microglial cells in vivo after unilateral injection of antibodies. PDGF-α-synuclein tg mice (line M) received intrahippocampal injection, as in Figure 7. Images in A–E are from the dentate gyrus and in the site ipsilateral to the injection. Scale bar, 10 μm. A, Double labeling with antibodies against α-synuclein (red) and microglial marker (Iba1, green). B, Image analysis for double labeling for estimation of the proportion of Iba-1-positive cells that colocalize with α-synuclein. n = 8 per group, 9 months old. *p < 0.01 by two-tailed Student's t test, unpaired. C, Double labeling with antibodies against mouse IgG (red) and Iba-1 (green). D, Image analysis for double labeling for estimation of the proportion of Iba-1-positive cells that colocalize with mouse IgG (n = 8 per group, 9 months old; *p < 0.01 by two tailed Student's t test, unpaired). E, Double labeling with antibodies against mouse IgG (red) and α-synuclein (green). Arrowheads indicate colocalization of two markers in each panel. All images in F–K are from the hippocampus in the site ipsilateral to the injection. F, Example of microglia double labeled with antibodies against α-synuclein (red) and Iba-1 (green). G, Percentage of Iba-1-positive cells with α-synuclein at 1, 7, 14, and 28 d post injection. H, Double labeling with antibodies against α-synuclein (red) and neuronal marker (NeuN, green). Arrowheads indicate colocalization in the top, while arrows in the bottom illustrate spindle-shaped α-synuclein-positive cell that does not colocalize with NeuN. I, Image analysis for double labeling for estimation of the proportion of NeuN-positive cells that colocalize with α-synuclein. n = 8 per group, 9 months old. J, Double labeling with antibodies against α-synuclein (red) and GFAP (green). Arrowheads indicate α-synuclein-positive neurons that do not colocalize with GFAP; arrows indicate α-synuclein-positive cells that do colocalize with GFAP. K, Image analysis for double labeling for estimation of the proportion of GFAP-positive cells that colocalize with antibody against α-synuclein (n = 8 per group, 9 months old; *p < 0.05 by one-way ANOVA, post hoc Tukey–Kramer). Scale bars: H, J, 25 μm.
Figure 9.
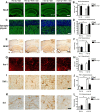
Behavioral improvement and reduced α-synuclein deposition in α-synuclein tg mice after passive immunization with 274 antibody. A, Total time traveled to descend the pole test. B, Open field total spontaneous activity (numbers of crosses of photoelectric cell). C, Open field total distance traveled after 5 min of spontaneous activity testing. D, Open field total number of rearings after 5 min of spontaneous activity testing. A–D, *p < 0.05 by one-way ANOVA with post hoc Dunnet's when comparing non-tg and α-synuclein tg; #p < 0.05 by one-way ANOVA with post hoc Fisher when comparing IgG and 274 antibody in α-synuclein tg. E, Low-magnification view (×20) of α-synuclein immunoreactivity in the cortex and hippocampus. The squares represent the areas magnified in F and G. Scale bar, 250 μm. F, G, Higher magnification (×630) views (F, astrocytes; G, neurons). Scale bar, 20 μm. H–J, Image analysis of the estimated numbers (disector method) of glial cells and neuronal cells displaying α-synuclein in the neocortex, hippocampus, and striatum, respectively. *p < 0.001 by Student's t test. K, Double labeling with antibodies against α-synuclein (red) and neuronal marker (NeuN, green) in hippocampus. Arrowheads indicate colocalization. L, Image analysis for double labeling for estimation of the proportion of NeuN-positive cells that colocalize with α-synuclein. M, Double labeling with antibodies against α-synuclein (red) and GFAP (green) in hippocampus. Arrowheads indicate α-synuclein-positive cells that colocalize with astroglia. N, Image analysis for double labeling for estimation of the proportion of GFAP-positive cells that colocalize with antibody against α-synuclein. O, Double labeling with antibodies against α-synuclein (red) and Iba-1 (green) in hippocampus. Arrowheads indicate α-synuclein-positive cells that colocalize with microglia. P, Image analysis for double labeling for estimation of the proportion of Iba-1-positive cells that colocalize with antibody against α-synuclein. Q, Double labeling with antibodies against α-synuclein (red) and cathepsin D (green) in hippocampus. Arrowheads indicate colocalization. R, Image analysis for double labeling for estimation of the proportion of cathepsin-D-positive cells that colocalize with antibody against α-synuclein. Scale bar, 10 μm. *p < 0.01 by Student's t test unpaired, two-tailed. n = 8- to 10-month-old mice.
Figure 10.
Reduced neurodegeneration and pro-inflammatory cytokines after passive immunization with 274 antibody. A, Low-magnification view (×20) of sections immunostained with an antibody against NeuN in non-tg and α-synuclein tg mice treated with IgG or 274 antibody. α-synuclein tg mice treated with IgG show neuronal loss in the hippocampus (arrows). Scale bar, 250 μm. B, Stereological analysis (disector method) of NeuN in the hippocampus. C, Higher magnification (×630) view of hippocampal sections immunostained with an antibody against synaptophysin in non-tg and α-synuclein tg mice treated with the IgG and 274 antibody respectively, Scale bar, 20 μm. D, Stereological analysis (disector method) of synaptophysin in the hippocampus. E, Low-magnification view (×20) of sections immunostained with an antibody against GFAP in non-tg and α-synuclein tg mice treated with IgG or 274 antibody. α-synuclein tg mice treated with IgG show increased astrogliosis in the neocortex (inset) and hippocampus. Scale bar, 250 μm. F, Image analysis of GFAP immunoreactivity expressed in optical density. The measurements were performed in the whole hippocampus. G, Higher magnification (×630) view of hippocampal sections immunostained with an antibody against Iba-1 in non-tg and α-synuclein tg mice treated with the IgG and 274 antibody, respectively. Scale bar, 20 μm. H, Image analysis of the estimated numbers of microglial cells in the hippocampus. *p < 0.05 by one-way ANOVA with post hoc Dunnet's when comparing non-tg and α-synuclein tg; #p < 0.05 by one-way ANOVA with post hoc Fisher when comparing IgG and 274 antibody in α-synuclein tg. I–L, Sections were immunolabeled with antibodies against TNFα and IL-6 and microdensitometric analysis was performed in the hippocampus. Compared with non-tg controls, in the α-synuclein tg mice treated with IgG, levels of TNFα (I, J) and IL-6 (K, L) were elevated, while treatment with the 274 antibody reduced levels of these cytokines in α-synuclein tg mice. *p < 0.05 by one-way ANOVA with post hoc Dunnet's when comparing non-tg and α-synuclein tg and Fisher when comparing treatment groups.
Similar articles
- Anti-α-synuclein immunotherapy reduces α-synuclein propagation in the axon and degeneration in a combined viral vector and transgenic model of synucleinopathy.
Spencer B, Valera E, Rockenstein E, Overk C, Mante M, Adame A, Zago W, Seubert P, Barbour R, Schenk D, Games D, Rissman RA, Masliah E. Spencer B, et al. Acta Neuropathol Commun. 2017 Jan 13;5(1):7. doi: 10.1186/s40478-016-0410-8. Acta Neuropathol Commun. 2017. PMID: 28086964 Free PMC article. - Immunotherapy targeting toll-like receptor 2 alleviates neurodegeneration in models of synucleinopathy by modulating α-synuclein transmission and neuroinflammation.
Kim C, Spencer B, Rockenstein E, Yamakado H, Mante M, Adame A, Fields JA, Masliah D, Iba M, Lee HJ, Rissman RA, Lee SJ, Masliah E. Kim C, et al. Mol Neurodegener. 2018 Aug 9;13(1):43. doi: 10.1186/s13024-018-0276-2. Mol Neurodegener. 2018. PMID: 30092810 Free PMC article. - Selective molecular alterations in the autophagy pathway in patients with Lewy body disease and in models of alpha-synucleinopathy.
Crews L, Spencer B, Desplats P, Patrick C, Paulino A, Rockenstein E, Hansen L, Adame A, Galasko D, Masliah E. Crews L, et al. PLoS One. 2010 Feb 19;5(2):e9313. doi: 10.1371/journal.pone.0009313. PLoS One. 2010. PMID: 20174468 Free PMC article. Retracted. - Immunotherapy targeting α-synuclein, with relevance for future treatment of Parkinson's disease and other Lewy body disorders.
Lindström V, Ihse E, Fagerqvist T, Bergström J, Nordström E, Möller C, Lannfelt L, Ingelsson M. Lindström V, et al. Immunotherapy. 2014;6(2):141-53. doi: 10.2217/imt.13.162. Immunotherapy. 2014. PMID: 24491088 Review. - [Clinical and pathological study on early diagnosis of Parkinson's disease and dementia with Lewy bodies].
Orimo S. Orimo S. Rinsho Shinkeigaku. 2008 Jan;48(1):11-24. doi: 10.5692/clinicalneurol.48.11. Rinsho Shinkeigaku. 2008. PMID: 18386627 Review. Japanese.
Cited by
- Modification of Glial Cell Activation through Dendritic Cell Vaccination: Promises for Treatment of Neurodegenerative Diseases.
Sabahi M, Joshaghanian A, Dolatshahi M, Jabbari P, Rahmani F, Rezaei N. Sabahi M, et al. J Mol Neurosci. 2021 Jul;71(7):1410-1424. doi: 10.1007/s12031-021-01818-6. Epub 2021 Mar 13. J Mol Neurosci. 2021. PMID: 33713321 Review. - Intruders or protectors - the multifaceted role of B cells in CNS disorders.
Aspden JW, Murphy MA, Kashlan RD, Xiong Y, Poznansky MC, Sîrbulescu RF. Aspden JW, et al. Front Cell Neurosci. 2024 Jan 10;17:1329823. doi: 10.3389/fncel.2023.1329823. eCollection 2023. Front Cell Neurosci. 2024. PMID: 38269112 Free PMC article. Review. - The Contribution of Microglia to Neuroinflammation in Parkinson's Disease.
Badanjak K, Fixemer S, Smajić S, Skupin A, Grünewald A. Badanjak K, et al. Int J Mol Sci. 2021 Apr 28;22(9):4676. doi: 10.3390/ijms22094676. Int J Mol Sci. 2021. PMID: 33925154 Free PMC article. Review. - Targeting α-synuclein for treatment of Parkinson's disease: mechanistic and therapeutic considerations.
Dehay B, Bourdenx M, Gorry P, Przedborski S, Vila M, Hunot S, Singleton A, Olanow CW, Merchant KM, Bezard E, Petsko GA, Meissner WG. Dehay B, et al. Lancet Neurol. 2015 Aug;14(8):855-866. doi: 10.1016/S1474-4422(15)00006-X. Epub 2015 Jun 3. Lancet Neurol. 2015. PMID: 26050140 Free PMC article. Review. - The Interplay between Alpha-Synuclein Clearance and Spreading.
Lopes da Fonseca T, Villar-Piqué A, Outeiro TF. Lopes da Fonseca T, et al. Biomolecules. 2015 Apr 14;5(2):435-71. doi: 10.3390/biom5020435. Biomolecules. 2015. PMID: 25874605 Free PMC article. Review.
References
- Andoh T, Kuraishi Y. Direct action of immunoglobulin G on primary sensory neurons through Fc gamma receptor I. FASEB J. 2004;18:182–184. - PubMed
- Barabé F, Rollet-Labelle E, Gilbert C, Fernandes MJ, Naccache SN, Naccache PH. Early events in the activation of Fc gamma RIIA in human neutrophils: stimulated insolubilization, translocation to detergent-resistant domains, and degradation of Fc gamma RIIA. J Immunol. 2002;168:4042–4049. - PubMed
- Bard F, Cannon C, Barbour R, Burke RL, Games D, Grajeda H, Guido T, Hu K, Huang J, Johnson-Wood K, Khan K, Kholodenko D, Lee M, Lieberburg I, Motter R, Nguyen M, Soriano F, Vasquez N, Weiss K, Welch B, et al. Peripherally administered antibodies against amyloid beta-peptide enter the central nervous system and reduce pathology in a mouse model of Alzheimer disease. Nat Med. 2000;6:916–919. - PubMed
Publication types
MeSH terms
Substances
Grants and funding
- AG 18840/AG/NIA NIH HHS/United States
- NS 044233/NS/NINDS NIH HHS/United States
- AG 022074/AG/NIA NIH HHS/United States
- R37 AG018440/AG/NIA NIH HHS/United States
- P01 AG022074/AG/NIA NIH HHS/United States
- P01 NS044233/NS/NINDS NIH HHS/United States
- R37 AG011385/AG/NIA NIH HHS/United States
- AG 11385/AG/NIA NIH HHS/United States
- R01 AG011385/AG/NIA NIH HHS/United States
LinkOut - more resources
Full Text Sources
Other Literature Sources
Miscellaneous


