Tau protein diffuses along the microtubule lattice - PubMed (original) (raw)
Tau protein diffuses along the microtubule lattice
Maike H Hinrichs et al. J Biol Chem. 2012.
Abstract
Current models for the intracellular transport of Tau protein suggest motor protein-dependent co-transport with microtubule fragments and diffusion of Tau in the cytoplasm, whereas Tau is believed to be stationary while bound to microtubules and in equilibrium with free diffusion in the cytosol. Observations that members of the microtubule-dependent kinesin family show Brownian motion along microtubules led us to hypothesize that diffusion along microtubules could also be relevant in the case of Tau. We used single-molecule total internal reflection fluorescence microscopy to probe for diffusion of individual fluorescently labeled Tau molecules along microtubules. This allowed us to avoid the problem that microtubule-dependent diffusion could be masked by excess of labeled Tau in solution that might occur in in vivo overexpression experiments. We found that approximately half of the individually detected Tau molecules moved bidirectionally along microtubules over distances up to several micrometers. Diffusion parameters such as diffusion coefficient, interaction time, and scanned microtubule length did not change with Tau concentration. Tau binding and diffusion along the microtubule lattice, however, were sensitive to ionic strength and pH and drastically reduced upon enzymatic removal of the negatively charged C termini of tubulin. We propose one-dimensional Tau diffusion guided by the microtubule lattice as one possible additional mechanism for Tau distribution. By such one-dimensional microtubule lattice diffusion, Tau could be guided to both microtubule ends, i.e. the sites where Tau is needed during microtubule polymerization, independently of directed motor-dependent transport. This could be important in conditions where active transport along microtubules might be compromised.
Figures
FIGURE 1.
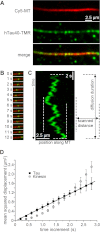
Tau molecules diffuse along MTs. A, TIRF microscopy images of a Cy5-labeled MT (red) and TMR-labeled hTau40 molecules (green) at a Tau:tubulin ratio of 100 p
m
:50 n
m
. hTau40-TMR shows clear co-localization and enrichment on Cy5-labeled MTs. B, sequential frames of a TMR-labeled hTau40 molecule (green) moving along an immobilized Cy5-labeled MT (red) in the absence of ATP. The Tau:tubulin ratio was 100 p
m
:50 n
m
. Only 5% of the Tau molecules were TMR-labeled. Time intervals were as indicated. C, kymograph of the movement of the hTau40-TMR molecule shown in B. Horizontal dashed lines indicate start and end of diffusive interaction, respectively. The extreme positions along the MT reached during this diffusive encounter of ∼15 s are depicted as vertical dashed lines. D, mean squared displacement <x_2> of the same hTau40-TMR molecule (black squares) plotted against time increment, i.e. different time intervals over which displacement was determined. Data fitted by a linear regression (black line) to the equation <_x_2> = 2_Dt yielded a diffusion coefficient D of 0.292 μm2/s. As an example for directed motion the gray circles depict data derived from a single kinesin-1 molecule moving linearly along an MT with a speed of 0.481 μm/s in the presence of 1 m
m
ATP. Error bars represent the S.E. of the squared displacement values.
FIGURE 2.
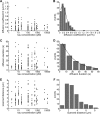
The diffusive behavior of Tau molecules is independent of the total Tau concentration. A, diffusion coefficients of individual hTau40-TMR molecules at different Tau concentrations. Concentration of tubulin was 50 n
m
. B, distribution of diffusion coefficients of 170 hTau40-TMR molecules at various total Tau concentrations. A Gaussian fit (black curve) yielded a mean value for the diffusion coefficient D of 0.153 ± 0.019 μm2/s. C, interaction times between individual hTau40-TMR molecules and Cy5-labeled MTs at different Tau concentrations in the presence of 50 n
m
tubulin. D, distribution of interaction durations of 170 hTau40-TMR molecules at various total Tau concentrations. An exponential decay (black curve) fitted to the data yielded, when corrected for photobleaching (
supplemental Fig. S5_D_
), a diffusion time constant of 24.41 ± 1.78 s. E, distances on MTs scanned by individual hTau40-TMR molecules during their interaction times at different Tau concentrations in the presence of 50 n
m
tubulin. F, distribution of observed distances on MTs scanned by individual hTau40-TMR molecules (n = 170) at various total Tau concentrations.
FIGURE 3.
The C terminus of tubulin facilitates Tau binding to MTs and Tau diffusion. A, TIRF microscopy images of three (1–3) Cy5-labeled subtilisin-digested MTs (red) immobilized together with unlabeled undigested MTs. TMR-labeled hTau40 molecules (green) bound preferentially to undigested but not to subtilisin-digested MTs, making the unlabeled undigested MTs visible (indicated as dashed white lines). B, 60-s kymographs of few but mainly stationary hTau40-TMR molecules on Cy5-labeled subtilisin-digested MTs (1–3, from A). More hTau40-TMR molecules bound to two unlabeled undigested MTs († and ‡, from A) and showed clear movement. Scale bars, 2.5 μm. C, Coomassie Brilliant Blue-stained SDS-PAGE of undigested unlabeled MTs (Ø-MT) and partially Cy5-labeled subtilisin-digested MTs (s-MT, 200 μg/ml subtilisin for 20 min at 35 °C), marker: 50, 60 kDa.
FIGURE 4.
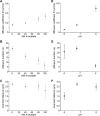
The diffusion of Tau molecules along MTs is sensitive to ionic strength and pH. A, diffusion coefficient D of TMR-labeled hTau40 molecules diffusing along MTs versus potassium acetate concentration added to buffer BRB12 resulting in final ionic strength of ∼40, 80, 120, and 140 m
m
, respectively. Error bars represent error margins of the Gaussian fits. B, diffusion time, corrected for photobleaching, of TMR-labeled hTau40 molecules versus potassium acetate added to buffer BRB12. Error bars represent error margins of the exponential decay fits to the observed duration and the TMR fluorescence decay. C, MT sections scanned by hTau40-TMR molecules (calculated from the diffusions constants and the respective corrected interaction times) versus potassium acetate concentration. Error margins were calculated from the error margins in A and B. D, diffusion coefficient D of hTau40-TMR molecules diffusing along MTs versus pH of buffer BRB12. Error bars represent error margins of the Gaussian fits. E, photobleaching corrected diffusion time of hTau40-TMR molecules versus pH of buffer BRB12. Error bars represent error margins of the exponential decay fits to the observed duration and the TMR fluorescence decay. F, MT sections scanned by hTau40-TMR molecules versus pH of buffer BRB12 (calculated from the respective diffusions constants and interaction times). Error margins were calculated from the error margins in E and F.
FIGURE 5.
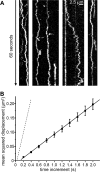
Diffusion of an IgG antibody along immobilized MTs. A, 60-s kymographs of rhodamine-labeled anti-dynein IgG antibodies (40 ng/ml) moving bidirectionally along two different immobilized Cy5-labeled MTs. B, mean squared displacement <x_2> (black squares) of a rhodamine-labeled antibody (bright mobile molecule in the leftmost kymograph in A) plotted against the time increment. The data were fitted by a linear regression (black line) to the equation <_x_2> = 2_Dt yielding the diffusion coefficient D (0.0497 μm2/s). Error bars represent the S.E. of the squared displacement values. For comparison, the dashed line represents data derived from the diffusing hTau40-TMR molecule shown in Fig. 1_D_.
Similar articles
- Transport and diffusion of Tau protein in neurons.
Scholz T, Mandelkow E. Scholz T, et al. Cell Mol Life Sci. 2014 Aug;71(16):3139-50. doi: 10.1007/s00018-014-1610-7. Epub 2014 Apr 1. Cell Mol Life Sci. 2014. PMID: 24687422 Free PMC article. Review. - Single-molecule imaging of Tau dynamics on the microtubule surface.
Stern JL, Lessard DV, Ali R, Berger CL. Stern JL, et al. Methods Cell Biol. 2017;141:135-154. doi: 10.1016/bs.mcb.2017.06.016. Epub 2017 Aug 8. Methods Cell Biol. 2017. PMID: 28882299 Free PMC article. - Differential regulation of dynein and kinesin motor proteins by tau.
Dixit R, Ross JL, Goldman YE, Holzbaur EL. Dixit R, et al. Science. 2008 Feb 22;319(5866):1086-9. doi: 10.1126/science.1152993. Epub 2008 Jan 17. Science. 2008. PMID: 18202255 Free PMC article. - Dynamical decoration of stabilized-microtubules by Tau-proteins.
Hervy J, Bicout DJ. Hervy J, et al. Sci Rep. 2019 Aug 28;9(1):12473. doi: 10.1038/s41598-019-48790-1. Sci Rep. 2019. PMID: 31462746 Free PMC article. - Structural principles of tau and the paired helical filaments of Alzheimer's disease.
Mandelkow E, von Bergen M, Biernat J, Mandelkow EM. Mandelkow E, et al. Brain Pathol. 2007 Jan;17(1):83-90. doi: 10.1111/j.1750-3639.2007.00053.x. Brain Pathol. 2007. PMID: 17493042 Free PMC article. Review.
Cited by
- TPX2 Inhibits Eg5 by Interactions with Both Motor and Microtubule.
Balchand SK, Mann BJ, Titus J, Ross JL, Wadsworth P. Balchand SK, et al. J Biol Chem. 2015 Jul 10;290(28):17367-79. doi: 10.1074/jbc.M114.612903. Epub 2015 May 27. J Biol Chem. 2015. PMID: 26018074 Free PMC article. - Crowd Control: Effects of Physical Crowding on Cargo Movement in Healthy and Diseased Neurons.
Sabharwal V, Koushika SP. Sabharwal V, et al. Front Cell Neurosci. 2019 Oct 25;13:470. doi: 10.3389/fncel.2019.00470. eCollection 2019. Front Cell Neurosci. 2019. PMID: 31708745 Free PMC article. Review. - Tau and neuron aging.
Avila J, de Barreda EG, Pallas-Bazarra N, Hernandez F. Avila J, et al. Aging Dis. 2013 Feb;4(1):23-8. Epub 2012 Dec 3. Aging Dis. 2013. PMID: 23423462 Free PMC article. - The disordered N-terminus of HDAC6 is a microtubule-binding domain critical for efficient tubulin deacetylation.
Ustinova K, Novakova Z, Saito M, Meleshin M, Mikesova J, Kutil Z, Baranova P, Havlinova B, Schutkowski M, Matthias P, Barinka C. Ustinova K, et al. J Biol Chem. 2020 Feb 28;295(9):2614-2628. doi: 10.1074/jbc.RA119.011243. Epub 2020 Jan 17. J Biol Chem. 2020. PMID: 31953325 Free PMC article. - Electrostatics of Tau Protein by Molecular Dynamics.
Castro TG, Munteanu FD, Cavaco-Paulo A. Castro TG, et al. Biomolecules. 2019 Mar 23;9(3):116. doi: 10.3390/biom9030116. Biomolecules. 2019. PMID: 30909607 Free PMC article.
References
- Cleveland D. W., Hwo S. Y., Kirschner M. W. (1977) Physical and chemical properties of purified Tau factor and the role of Tau in microtubule assembly. J. Mol. Biol. 116, 227–247 - PubMed
Publication types
MeSH terms
Substances
LinkOut - more resources
Full Text Sources


