QUAliFiER: an automated pipeline for quality assessment of gated flow cytometry data - PubMed (original) (raw)
QUAliFiER: an automated pipeline for quality assessment of gated flow cytometry data
Greg Finak et al. BMC Bioinformatics. 2012.
Abstract
Background: Effective quality assessment is an important part of any high-throughput flow cytometry data analysis pipeline, especially when considering the complex designs of the typical flow experiments applied in clinical trials. Technical issues like instrument variation, problematic antibody staining, or reagent lot changes can lead to biases in the extracted cell subpopulation statistics. These biases can manifest themselves in non-obvious ways that can be difficult to detect without leveraging information about the study design or other experimental metadata. Consequently, a systematic and integrated approach to quality assessment of flow cytometry data is necessary to effectively identify technical errors that impact multiple samples over time. Gated cell populations and their statistics must be monitored within the context of the experimental run, assay, and the overall study.
Results: We have developed two new packages, flowWorkspace and QUAliFiER to construct a pipeline for quality assessment of gated flow cytometry data. flowWorkspace makes manually gated data accessible to BioConductor's computational flow tools by importing pre-processed and gated data from the widely used manual gating tool, FlowJo (Tree Star Inc, Ashland OR). The QUAliFiER package takes advantage of the manual gates to perform an extensive series of statistical quality assessment checks on the gated cell sub-populations while taking into account the structure of the data and the study design to monitor the consistency of population statistics across staining panels, subject, aliquots, channels, or other experimental variables. QUAliFiER implements SVG-based interactive visualization methods, allowing investigators to examine quality assessment results across different views of the data, and it has a flexible interface allowing users to tailor quality checks and outlier detection routines to suit their data analysis needs.
Conclusion: We present a pipeline constructed from two new R packages for importing manually gated flow cytometry data and performing flexible and robust quality assessment checks. The pipeline addresses the increasing demand for tools capable of performing quality checks on large flow data sets generated in typical clinical trials. The QUAliFiER tool objectively, efficiently, and reproducibly identifies outlier samples in an automated manner by monitoring cell population statistics from gated or ungated flow data conditioned on experiment-level metadata.
Figures
Figure 1
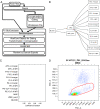
Functionality of flowWorkspace applied to the QA template gating hierarchy of the test data in the QUAliFiER pipeline. Functionality of flowWorkspace applied to the QA template gating hierarchy of the test data in the QUAliFiER pipeline. A) The design of flowWorkspace and its interface with QUAliFiER, FlowJo and BioConductor. B) The gating hierarchy for the first sample in the test workspace imported by flowWorkspace and displayed via
plot
. The names of the QA gates defined in the FlowJo workspace for the gating template are displayed. This gating template was designed for performing quality assessment of flow data from the ITN (Immune Tolerance Network). MNC is a mononuclear cell gate. WBC_perct is a white blood cell gate. Gates on specific channels with MFI and margin are for detecting the positive populations and boundary events, respectively in each channel. C) Agreement between imported population statistics computed using flowWorkspace and statistics computed from FlowJo, measured via the coefficient of variation between the two values. Slight deviations are due to FlowJo’s discretization of the data transformation function, which must be interpolated by flowWorkspace. Overall the CV is fractions of a percent, indicating successful import. D) Example of the dot plots generated by flowWorkspace to visualize gated populations.
Figure 2
QA result of of MFI stability vs time for the FITC channel. We can see clear examples where the MFI is not stable over time, i.e. it is either increasing (HLADR, CD8, CD11c), or decreasing (LD). Some stains show residuals that are not normally distributed, suggesting non-linear trends (HLADR, CD8, CD57), while others are generally stable with the occasional sample outlier (CD1c, IgG1, 6B11). The formula used to generate the plot is: MFI_∼_RecdDt|channel_∗_stain, where the MFI is plotted against RecdDt, the date the sample was run, which is defined in the study metadata. Channel and stain are generated upon parsing the workspace. Outlier calls are done within each combination of channel and stain. An additional argument to
plot(..,subset=channel='FITC',..)
tells the function to plot only the output for the FITC channel. The population for this
qaTask
is the population, MFI, which selects all MFI gates.
Figure 3
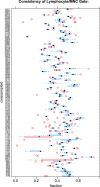
Consistency of the mononuclear cell gate across aliquots. The plot shows the consistency of the MNC population across aliquots (coresampleid). The plot type is bwplot, and the formula for generating this output is coresampleid_∼_proportion, while the
qaCheck
was generated with proportion_∼_coresampleid. Additional lattice plot arguments to generate a vertical boxplot layout are passed through the
@par
slot of the
qaTask
object. Note that there is no stratification variable. The bwplot plot type implies a grouping using the coresampleid variable (defined in the study metadata). Boxplots are generated for each level of coresampleid and outlier calls (red boxes and points) are made within each group as well as between groups (i.e., identifying groups with larger than expected variability). The population for this
qaTask
is MNC, the mononuclear cell gate.
Figure 4
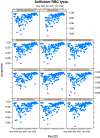
Consistency of red blood cell lysis across staining panels. If red blood cells are not properly lysed, they will be detected as events in the FCM experiment. Under ideal conditions, only white blood cells would be detected. The outlier threshold is set such that at least 80% of events should be within the white blood cell gate. Between one and two samples within each staining panel were identified as having lower than expected red blood cell lysis efficiency. Closer inspection revealed these to be from the same coresampleid.
Figure 5
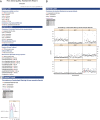
An xample of the HTML Quality Assessment Report Generated by the QUAliFiER Package. A) qaTasks are categorized by assay level, channel level, or tube level, depending on the grouping variables for outlier detection. Within each category, a summary of the number of FCS files failing that qaTask is visible. B) Clicking on the “+” signs expands a more detailed view of the qaTask, including summary plots and tables. The summary plots themselves are interactive through the use of SVG graphics. The consistency of redundant staining is shown as boxplots of the % of marker positive cells grouped by stain. C) Clicking on individual points in the summary plots opens more detailed plots of the cell populations for individual samples failing the qaTask. Densityplots of one of the outlier groups show two samples with inconsistent positive staining in the FITC channel.
Figure 6
Dot plots of outlier MNC samples. Dot plots of the MNC gates for coresampleid 11732, one of the group outliers identified by the MNC stability qaTask. Samples with lower proportions of lymphocytes inside the gate are readily visible, caused by elevated debris in the sample.
Similar articles
- Data-Driven Flow Cytometry Analysis.
Wang S, Brinkman RR. Wang S, et al. Methods Mol Biol. 2019;1989:245-265. doi: 10.1007/978-1-4939-9454-0_16. Methods Mol Biol. 2019. PMID: 31077110 Free PMC article. Review. - DAFi: A directed recursive data filtering and clustering approach for improving and interpreting data clustering identification of cell populations from polychromatic flow cytometry data.
Lee AJ, Chang I, Burel JG, Lindestam Arlehamn CS, Mandava A, Weiskopf D, Peters B, Sette A, Scheuermann RH, Qian Y. Lee AJ, et al. Cytometry A. 2018 Jun;93(6):597-610. doi: 10.1002/cyto.a.23371. Epub 2018 Apr 17. Cytometry A. 2018. PMID: 29665244 Free PMC article. - High throughput automated analysis of big flow cytometry data.
Rahim A, Meskas J, Drissler S, Yue A, Lorenc A, Laing A, Saran N, White J, Abeler-Dörner L, Hayday A, Brinkman RR. Rahim A, et al. Methods. 2018 Feb 1;134-135:164-176. doi: 10.1016/j.ymeth.2017.12.015. Epub 2017 Dec 27. Methods. 2018. PMID: 29287915 Free PMC article. - Optimizing transformations for automated, high throughput analysis of flow cytometry data.
Finak G, Perez JM, Weng A, Gottardo R. Finak G, et al. BMC Bioinformatics. 2010 Nov 4;11:546. doi: 10.1186/1471-2105-11-546. BMC Bioinformatics. 2010. PMID: 21050468 Free PMC article. - An Introduction to Automated Flow Cytometry Gating Tools and Their Implementation.
Verschoor CP, Lelic A, Bramson JL, Bowdish DM. Verschoor CP, et al. Front Immunol. 2015 Jul 27;6:380. doi: 10.3389/fimmu.2015.00380. eCollection 2015. Front Immunol. 2015. PMID: 26284066 Free PMC article. Review.
Cited by
- Targeted inhibition of RBPJ transcription complex alleviates the exhaustion of CD8+ T cells in hepatocellular carcinoma.
Pan B, Wang Z, Zhang X, Shen S, Ke X, Qiu J, Yao Y, Wu X, Wang X, Tang N. Pan B, et al. Commun Biol. 2023 Jan 30;6(1):123. doi: 10.1038/s42003-023-04521-x. Commun Biol. 2023. PMID: 36717584 Free PMC article. - TGF-β-p-STAT1-LAIR2 axis has a "self-rescue" role for exhausted CD8+ T cells in hepatocellular carcinoma.
Pan B, Wang Z, Yao Y, Ke X, Shen S, Chen W, Zhang X, Qiu J, Wu X, Tang N. Pan B, et al. Cell Oncol (Dordr). 2023 Dec;46(6):1625-1644. doi: 10.1007/s13402-023-00830-9. Epub 2023 May 24. Cell Oncol (Dordr). 2023. PMID: 37223874 - Data-Driven Flow Cytometry Analysis.
Wang S, Brinkman RR. Wang S, et al. Methods Mol Biol. 2019;1989:245-265. doi: 10.1007/978-1-4939-9454-0_16. Methods Mol Biol. 2019. PMID: 31077110 Free PMC article. Review. - Single-cell atlas reveals characteristic changes in intrahepatic HBV-specific leukocytes.
Pan B, Wang Z, Chen R, Zhang X, Qiu J, Wu X, Yao Y, Luo Y, Wang X, Tang N. Pan B, et al. Microbiol Spectr. 2024 Jan 11;12(1):e0286023. doi: 10.1128/spectrum.02860-23. Epub 2023 Nov 30. Microbiol Spectr. 2024. PMID: 38032223 Free PMC article. - SUMOylation inhibitors activate anti-tumor immunity by reshaping the immune microenvironment in a preclinical model of hepatocellular carcinoma.
Wang Z, Pan B, Su L, Yu H, Wu X, Yao Y, Zhang X, Qiu J, Tang N. Wang Z, et al. Cell Oncol (Dordr). 2024 Apr;47(2):513-532. doi: 10.1007/s13402-023-00880-z. Epub 2023 Dec 6. Cell Oncol (Dordr). 2024. PMID: 38055116
References
- Hengel RL, Nicholson JK. An update on the use of flow cytometry in HIV infection and AIDS. Clin Lab Med. 2001;21(4):841–856. - PubMed
- Illoh OC. Current applications of flow cytometry in the diagnosis of primary immunodeficiency diseases. Arch Pathol Lab Med. 2004;128:23–31. - PubMed
- Kiechle FL, Holland-Staley CA. Genomics, transcriptomics, proteomics, and numbers. Arch Pathol Lab Med. 2003;127(9):1089–1097. - PubMed
Publication types
MeSH terms
LinkOut - more resources
Full Text Sources
Other Literature Sources
Molecular Biology Databases


