Regulated accumulation of desmosterol integrates macrophage lipid metabolism and inflammatory responses - PubMed (original) (raw)
. 2012 Sep 28;151(1):138-52.
doi: 10.1016/j.cell.2012.06.054.
Lana X Garmire, Jeffrey G McDonald, David S Myers, Stephen B Milne, Norihito Shibata, Donna Reichart, Jesse N Fox, Iftach Shaked, Daniel Heudobler, Christian R H Raetz, Elaine W Wang, Samuel L Kelly, M Cameron Sullards, Robert C Murphy, Alfred H Merrill Jr, H Alex Brown, Edward A Dennis, Andrew C Li, Klaus Ley, Sotirios Tsimikas, Eoin Fahy, Shankar Subramaniam, Oswald Quehenberger, David W Russell, Christopher K Glass
Affiliations
- PMID: 23021221
- PMCID: PMC3464914
- DOI: 10.1016/j.cell.2012.06.054
Regulated accumulation of desmosterol integrates macrophage lipid metabolism and inflammatory responses
Nathanael J Spann et al. Cell. 2012.
Abstract
Inflammation and macrophage foam cells are characteristic features of atherosclerotic lesions, but the mechanisms linking cholesterol accumulation to inflammation and LXR-dependent response pathways are poorly understood. To investigate this relationship, we utilized lipidomic and transcriptomic methods to evaluate the effect of diet and LDL receptor genotype on macrophage foam cell formation within the peritoneal cavities of mice. Foam cell formation was associated with significant changes in hundreds of lipid species and unexpected suppression, rather than activation, of inflammatory gene expression. We provide evidence that regulated accumulation of desmosterol underlies many of the homeostatic responses, including activation of LXR target genes, inhibition of SREBP target genes, selective reprogramming of fatty acid metabolism, and suppression of inflammatory-response genes, observed in macrophage foam cells. These observations suggest that macrophage activation in atherosclerotic lesions results from extrinsic, proinflammatory signals generated within the artery wall that suppress homeostatic and anti-inflammatory functions of desmosterol.
Copyright © 2012 Elsevier Inc. All rights reserved.
Figures
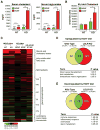
Figure 1. Overview of global effects of diet and LDLR KO genotype on the lipidome and transcriptome of elicited peritoneal macrophages
A. Serum cholesterol and triglyceride levels in elicited peritoneal macrophages from WT or LDLR KO mice fed either NCNF or HCHF diet. HCHF vs. NCNF: ***P<0.001, **P<0.01, *P<0.05. KO vs. WT:  P<0.001, ‡P<0.01, +P<0.05 (n=5). Error bars represent SEM. B. Total cellular cholesteryl esters in peritoneal macrophages derived from WT or LDLR KO mice fed either NCNF or HCHF diet. P-value notations are the same as A (n=9). C. Heat map of lipid changes in lipid categories. Log2 of ratio values are used in each entry. Red shading indicates up-regulation and green indicates down-regulation. For the subclasses under glycerophospholipids, the abbreviations are: PG (Glycerophosphoglycerols), PE (Glycerophosphoethanolamines), PC (Glycerophosphocholines), PI (Glycerophosphoinositols), PA (Phosphatidic acids), and PS (Glycerophosphoserines). D. Venn diagram of up-regulated genes and their overlap by HCHF diet >1.5× in the transcriptome of WT and LDLR KO macrophages, and _p_-values for selected GO terms. E. Venn diagram of down-regulated genes and their overlap by HCHF diet >1.5× in the transcriptome of WT and LDLR KO macrophages, and _p_-values for selected GO terms.
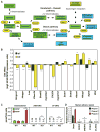
Figure 2. Foam cell formation is associated with increased cellular content of desmosterol
A. A simplified scheme of cholesterol and oxysterol biosynthetic pathways. Selected lipid intermediates are labeled in green boxes and important enzymes are labeled in yellow ellipses. Lipid species shown in blue boxes are LXR agonists. B. Effect of the HCHF diet on levels of mRNA transcripts of proteins involved in cholesterol homeostasis from WT and LDLR KO macrophages as determined by microarray analysis. ***P<0.001, **P<0.01, *P<0.05 (n=5). C. Cellular levels of selected endogenous LXR ligands. P-value notations are the same as Figure 1A (n=9). D. Levels of selected LXR ligands in human atherosclerotic lesions. Ligand levels per sample were normalized to cholestanol. Ligand vs. Desmosterol: ***P<0.001, **P<0.01, *P<0.05 (n=3). Error bars represent SEM.
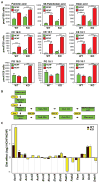
Figure 3. Foam cell formation is associated with altered fatty acid metabolism
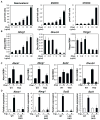
A. Cellular content of the indicated free fatty acids, cholesterol esters (CE) and Glycerophosphoglycerols (PG) in peritoneal macrophages from WT and LDLR KO mice fed either NCNF or HCHF diet. P-value notations are the same as Figure 1A (n=8–9). B. Scheme for biosynthesis of 9Z-palmitoleic acid and oleic acid. Selected lipid intermediates are labeled in green boxes and enzymes are labeled in yellow ellipses. C. Effect of the HCHF diet on levels of selected mRNA transcripts encoding proteins involved in fatty acid metabolism from WT and LDLR KO macrophages as determined by microarray analysis. ***P<0.001, **P<0.01, *P<0.05 (n=5). Error bars represent SEM.
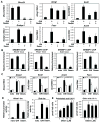
Figure 4. Desmosterol coordinately regulates LXR- and SREBP-dependent gene expression and induces synthesis of palmitoleic and oleic acid in macrophages
A. Q-PCR analysis of indicated mRNA transcripts in peritoneal macrophages treated with GW3965, desmosterol or both. B. ChIP assay of SREBP at sterol response elements that control the expression of the Dhcr24, Scd2, Fasn and Hmgcr genes in cholesterol-depleted peritoneal macrophages under control, GW3965 or desmosterol treatment (6hr). C. Effect of SREBP1 knockdown on the expression of genes involved in cholesterol and fatty acid metabolism in peritoneal macrophages under lipid-depleted, desmosterol or GW3965 treated conditions.  P<0.001, ‡P<0.01, +P<0.05 versus siCTL. D. Effect of GW3965 and desmosterol treatment on induction of indicated LXR reporter constructs in RAW264.7 cells. E. LC/MS analysis of the effects of desmosterol on cellular contents of 9Z-palmitoleic and oleic acid in peritoneal macrophages. For A, B, D and E ***P<0.001, **P<0.01, *P<0.05 versus control. Error bars represent SD.
Figure 5. Desmosterol accumulation and function in response to cholesterol loading of primary macrophages in vitro
A. LC/MS analysis of the effect of cholesterol loading of cholesterol starved peritoneal macrophages on media content of desmosterol, 25-OHC and 27-OHC. B. Effect of cholesterol loading on Abcg1, Dhcr24 and Hmgcr expression in the peritoneal macrophages used for analysis in panel A. C. Effect of cholesterol loading on expression of Abca1, Abcg1, Scd2 and Dhcr24 in wild type (WT) peritoneal macrophages and triple knockout (TKO) peritoneal macrophages deficient for Cyp46a1, Ch25h and Cyp27a1. For A, B and C, ***P<0.001, **P<0.01, *P<0.05 versus control. D. Effect of triparanol inhibition of DHCR24 enzyme activity on the indicated LXR and SREBP target genes in wild type (WT) and LXRα/β double knockout (LXR DKO) peritoneal macrophages. ***P<0.001 versus control.  P<0.001, ‡P<0.01 DKO versus WT. Error bars represent SD.
Figure 6. Desmosterol inhibits inflammatory gene expression
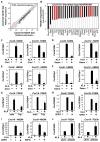
A. TLR4 target genes are suppressed in macrophages derived from LDLR KO mice fed a HCHF diet. Relative expression of the 200 most highly induced TLR4 target genes in WT macrophages are plotted for LDLR KO macrophages under HCHF and NCNF diet conditions. B. Relative expression levels of the 24 most down-regulated genes in LDLR KO macrophages from mice fed the HCHF vs. NCNF diets. TLR4-responsive genes highlighted in red. Results are plotted as log2 fold change. P<0.001 (n=9). C. Effect of cholesterol loading on KLA induced expression of Cxcl10 and Cxcl9 genes in peritoneal macrophages. D. Effect of desmosterol treatment on KLA induced expression of Cxcl9 and Cxcl10 genes in peritoneal macrophages. E. Effect of cholesterol loading on KLA induced expression of Cxcl9 and Cxcl10 genes in human monocyte derived macrophages. F. Effect of desmosterol treatment on KLA induced expression of Cxcl9 and Cxcl10 genes in human monocyte derived macrophages. G. Effect of triparanol inhibition of DHCR24 enzyme activity on the KLA responsiveness of Cxcl9 and Cxcl10 genes in peritoneal macrophages. H. Effect of 9Z-palmitoleic acid (9Z-PO) treatment on KLA responses of Cxcl9 and Cxcl10 genes in peritoneal macrophages. I. Effect of knockdown of Scd2 (72hr) on KLA responses of Cxcl9 and Cxcl10 genes in peritoneal macrophages. J. Effect of 9Z-palmitoleic acid (9Z-PO) treatment on KLA responses of Cxcl9 and Cxcl10 genes in human monocyte derived macrophages. For C-J, **P<0.01, *P<0.05 versus KLA or siCTL-KLA. Error bars represent SD. In all panels where indicated TGEM refers to thioglycollate-elicited macrophages and HMDM refers to human monocyte-derived macrophages.
Figure 7. Desmosterol inhibits inflammatory gene expression by LXR-dependent and LXR-independent mechanisms
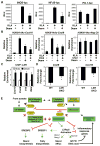
A. Effect of desmosterol treatment on KLA induction of relative luciferase activities of indicated reporter constructs in RAW264.7 cells. *P<0.01 versus KLA. B. ChIP analysis of effect of desmosterol treatment on KLA induced H3K9/14 acetylation (H3K9/14Ac) at promoter regions of desmosterol repressed Cxcl9 and Cxcl10 genes in peritoneal macrophages. Negative control (Neg Ctl) refers to genomic region lacking H3K9/14Ac enrichment. *P<0.05 versus KLA. C. ChIP analysis of LXR recruitment to desmosterol repressed loci of the Cxcl9, Cxcl10, IL1b and iNos genes in peritoneal macrophages treated with either vehicle (Notx) or desmosterol for 6hr. Relative enrichments are presented as % input of LXR ChIP normalized to IgG control. *P<0.05 versus control. D. Q-PCR analysis of the effect desmosterol treatment on KLA response of Cxcl9 and Cxcl10 genes in wild type (WT) and LXRα/β DKO (LXR DKO) macrophages. *P<0.05 versus WT. Results are plotted as log2 fold change. E. Model for mechanisms by which foam cell formation induces desmosterol accumulation, leading to integration of cholesterol and fatty acid metabolism and suppression of inflammatory gene expression. Error bars represent SD.
Similar articles
- Desmosterol suppresses macrophage inflammasome activation and protects against vascular inflammation and atherosclerosis.
Zhang X, McDonald JG, Aryal B, Canfrán-Duque A, Goldberg EL, Araldi E, Ding W, Fan Y, Thompson BM, Singh AK, Li Q, Tellides G, Ordovás-Montanes J, García Milian R, Dixit VD, Ikonen E, Suárez Y, Fernández-Hernando C. Zhang X, et al. Proc Natl Acad Sci U S A. 2021 Nov 23;118(47):e2107682118. doi: 10.1073/pnas.2107682118. Proc Natl Acad Sci U S A. 2021. PMID: 34782454 Free PMC article. - Enhanced synthesis of the oxysterol 24(S),25-epoxycholesterol in macrophages by inhibitors of 2,3-oxidosqualene:lanosterol cyclase: a novel mechanism for the attenuation of foam cell formation.
Rowe AH, Argmann CA, Edwards JY, Sawyez CG, Morand OH, Hegele RA, Huff MW. Rowe AH, et al. Circ Res. 2003 Oct 17;93(8):717-25. doi: 10.1161/01.RES.0000097606.43659.F4. Epub 2003 Sep 25. Circ Res. 2003. PMID: 14512442 - Macrophage Lxrα reduces atherosclerosis in Ldlr-/- mice independent of Arl7 transactivation.
Yin Y, Zeng S, Li Y, Wu Z, Huang D, Gao P. Yin Y, et al. Biochem Biophys Res Commun. 2020 Aug 27;529(3):540-547. doi: 10.1016/j.bbrc.2020.06.071. Epub 2020 Jul 15. Biochem Biophys Res Commun. 2020. PMID: 32736671 - Lipid homeostasis and the formation of macrophage-derived foam cells in atherosclerosis.
Yuan Y, Li P, Ye J. Yuan Y, et al. Protein Cell. 2012 Mar;3(3):173-81. doi: 10.1007/s13238-012-2025-6. Epub 2012 Mar 23. Protein Cell. 2012. PMID: 22447659 Free PMC article. Review. - Cytokines, macrophage lipid metabolism and foam cells: implications for cardiovascular disease therapy.
McLaren JE, Michael DR, Ashlin TG, Ramji DP. McLaren JE, et al. Prog Lipid Res. 2011 Oct;50(4):331-47. doi: 10.1016/j.plipres.2011.04.002. Epub 2011 May 13. Prog Lipid Res. 2011. PMID: 21601592 Review.
Cited by
- Lymphatic vasculature mediates macrophage reverse cholesterol transport in mice.
Martel C, Li W, Fulp B, Platt AM, Gautier EL, Westerterp M, Bittman R, Tall AR, Chen SH, Thomas MJ, Kreisel D, Swartz MA, Sorci-Thomas MG, Randolph GJ. Martel C, et al. J Clin Invest. 2013 Apr;123(4):1571-9. doi: 10.1172/JCI63685. Epub 2013 Mar 25. J Clin Invest. 2013. PMID: 23524964 Free PMC article. - Monocyte progenitors give rise to multinucleated giant cells.
Lösslein AK, Lohrmann F, Scheuermann L, Gharun K, Neuber J, Kolter J, Forde AJ, Kleimeyer C, Poh YY, Mack M, Triantafyllopoulou A, Dunlap MD, Khader SA, Seidl M, Hölscher A, Hölscher C, Guan XL, Dorhoi A, Henneke P. Lösslein AK, et al. Nat Commun. 2021 Apr 1;12(1):2027. doi: 10.1038/s41467-021-22103-5. Nat Commun. 2021. PMID: 33795674 Free PMC article. - Perception of self: distinguishing autoimmunity from autoinflammation.
van Kempen TS, Wenink MH, Leijten EF, Radstake TR, Boes M. van Kempen TS, et al. Nat Rev Rheumatol. 2015 Aug;11(8):483-92. doi: 10.1038/nrrheum.2015.60. Epub 2015 May 12. Nat Rev Rheumatol. 2015. PMID: 25963881 Review. - Immunological perspectives on atherosclerotic plaque formation and progression.
Pi H, Wang G, Wang Y, Zhang M, He Q, Zheng X, Yin K, Zhao G, Jiang T. Pi H, et al. Front Immunol. 2024 Sep 27;15:1437821. doi: 10.3389/fimmu.2024.1437821. eCollection 2024. Front Immunol. 2024. PMID: 39399488 Free PMC article. Review. - John Yudkin's hypothesis: sugar is a major dietary culprit in the development of cardiovascular disease.
Ting KKY. Ting KKY. Front Nutr. 2024 Jul 4;11:1407108. doi: 10.3389/fnut.2024.1407108. eCollection 2024. Front Nutr. 2024. PMID: 39027662 Free PMC article. Review.
References
- Avigan J, Steinberg D, Thompson MJ, Mosettig E. Mechanism of action of MER-29, an inhibitor of cholesterol biosynthesis. Biochem Biophys Res Commun. 1960;2:63–65. - PubMed
- Blake GJ, Ridker PM. C-reactive protein and other inflammatory risk markers in acute coronary syndromes. J Am Coll Cardiol. 2003;41:37S–42S. - PubMed
Publication types
MeSH terms
Substances
Grants and funding
- P01 HL088093/HL/NHLBI NIH HHS/United States
- P01 DK074868/DK/NIDDK NIH HHS/United States
- U54 GM069338/GM/NIGMS NIH HHS/United States
- GM U54 069338/GM/NIGMS NIH HHS/United States
- P30 CA046934/CA/NCI NIH HHS/United States
- P30 DK063491/DK/NIDDK NIH HHS/United States
- R01 HL115232/HL/NHLBI NIH HHS/United States
- P01 HC088093/HC/NHLBI NIH HHS/United States
LinkOut - more resources
Full Text Sources
Other Literature Sources
Medical
Molecular Biology Databases
