Defects in mitochondrial fission protein dynamin-related protein 1 are linked to apoptotic resistance and autophagy in a lung cancer model - PubMed (original) (raw)
Defects in mitochondrial fission protein dynamin-related protein 1 are linked to apoptotic resistance and autophagy in a lung cancer model
Kelly Jean Thomas et al. PLoS One. 2012.
Abstract
Evasion of apoptosis is implicated in almost all aspects of cancer progression, as well as treatment resistance. In this study, resistance to apoptosis was identified in tumorigenic lung epithelial (A549) cells as a consequence of defects in mitochondrial and autophagic function. Mitochondrial function is determined in part by mitochondrial morphology, a process regulated by mitochondrial dynamics whereby the joining of two mitochondria, fusion, inhibits apoptosis while fission, the division of a mitochondrion, initiates apoptosis. Mitochondrial morphology of A549 cells displayed an elongated phenotype-mimicking cells deficient in mitochondrial fission protein, Dynamin-related protein 1 (Drp1). A549 cells had impaired Drp1 mitochondrial recruitment and decreased Drp1-dependent fission. Cytochrome c release and caspase-3 and PARP cleavage were impaired both basally and with apoptotic stimuli in A549 cells. Increased mitochondrial mass was observed in A549 cells, suggesting defects in mitophagy (mitochondrial selective autophagy). A549 cells had decreased LC3-II lipidation and lysosomal inhibition suggesting defects in autophagy occur upstream of lysosomal degradation. Immunostaining indicated mitochondrial localized LC3 punctae in A549 cells increased after mitochondrial uncoupling or with a combination of mitochondrial depolarization and ectopic Drp1 expression. Increased inhibition of apoptosis in A549 cells is correlated with impeded mitochondrial fission and mitophagy. We suggest mitochondrial fission defects contribute to apoptotic resistance in A549 cells.
Conflict of interest statement
Competing Interests: The authors have declared that no competing interests exist.
Figures
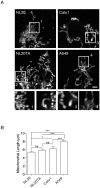
Figure 1. Mitochondrial length of lung epithelial cells.
(A) Representative mito-YFP expression in cells. Numbered boxes (1–4) are magnifications (10×) of the corresponding numbered boxed regions in the original images of NL20, NL20TA, Calu1 and A549. Scale bar is 2 µm. (B) Mean mitochondrial length (y-axis; ± SEM) measurements (n = 35–50) from three independent experiments for NL20, NL20TA, Calu1, and A549 cells. 1-way ANOVA analysis with Tukey post-tests (P<0.0001).
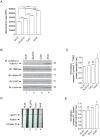
Figure 2. Mitochondrial mass of lung epithelial cells.
(A) Mitotracker green fluorescence relative fluorescence units (y-axis, RFU) represents mitochondrial mass (mean and SEM); measurements (n = 8 wells) from three independent experiments. 1-way ANOVA analysis with Tukey post-tests (P<0.0001). (B) Representative immunoblots demonstrating expression of endogenous proteins complex IV subunit I, TIM23, frataxin, and VDAC in NL20 (lane 1), NL20TA (lane 2), Calu1 (lane 3), and A549 (lane 4) cells. β-actin is shown for loading. Markers in kilodaltons (kDa). (C) Immunoblots from two independent experiments were quantified to show relative complex IV subunit I protein expression normalized to TIM23. Mean and SEM shown. 1-way ANOVA analysis with Tukey post-tests compared to NL20. (D) Representative mitochondrial biogenesis dipstick ELISA assay showing frataxin and complex IV expression. (E) Three independent mitochondrial biogenesis ELISA assays were quantified to show relative mitochondrial-encoded complex IV protein expression normalized to the nuclear-encoded frataxin protein. Mean and SEM shown. 1-way ANOVA analysis with Tukey post-tests compared to NL20.
Figure 3. Resistance to mitochondrial uncoupling.
TMRE staining from two independent experiments (n = 8). TMRE expression is plotted as a relative ratio ΔF/F0 showing mean and SEM, where F indicates fluorescence intensity and F0 indicates baseline values before stimulation following background subtraction**.** Cell lines NL20 (blue), NL20 (orange), Calu1 (pink1) and A549 (green) were treated with oligomycin (6 µM; 0 minutes) and CCCP (10 µM; 18 minutes) to induce hyperpolarization and depolarization, respectively. 2-way ANOVA analysis with Bonferroni post-tests.
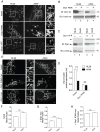
Figure 4. Decreased Drp1 protein expression and Drp1-dependent mitochondrial fission.
(A) Mitochondrial morphology of NL20 (left) and A549 (right) cells following mito-DsRED transfection. Representative images shown: basal (upper) and following Drp1 RNAi (middle) or Drp1-YFP transfection (lower). The scale bar indicates 2 µm. Numbered boxes (1–6) are magnifications (10×) of the corresponding numbered boxed regions in the original images. (B) Immunoblot of endogenous Drp1 expression before (lanes 1,3) and after (lanes 2,4) Drp1 RNAi transfection in NL20 and A549 cells. (C) Immunoblot of endogenous (lanes 1,2; arrow) and ectopic (lanes 3,4; arrowhead) Drp1 expression before and after Drp1-YFP transfection in NL20 and A549 cells. (B,C) β-actin reprobe to show loading; markers in kDa. (D) Relative Drp1 protein expression normalized to β-actin before and after Drp1 RNAi transfection in NL20 (white bar) and A549 (black bar) cells (two independent experiments). 2-way ANOVA analysis with Bonferroni post-tests. (E) Representative images from FRAP analysis of NL20 (left) and A549 (right) cells transfected with mito-YFP. Cells imaged under basal (top), Drp1 K38A-myc downregulation of Drp1 (middle) and Drp1-myc overexpression (bottom) conditions. Numbered boxes (1–6) are magnifications (10×) of the corresponding numbered boxed regions in the original images. Scale bar is 1 µm. (F–H) Mobile fraction of mito-YFP values occurring within a single subcellular region of interest (n = 60 cells). Mean and SEM shown from two independent experiments. 1-way ANOVA analysis with Tukey post-tests. Additional FRAP statistics are shown in Figure S2.
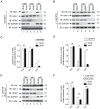
Figure 5. Impaired release of cytochrome c following apoptotic stimulus with STS.
(A,B, E) Representative immunoblots of three independent experiments of (A) untreated, (B) 1 µM STS treatment for 3 h to induce apoptosis, and (E) 1 µM STS treatment for 3 h after Drp1-myc transfection in NL20 and A549 cells. Endogenous Drp1 and cytochrome c protein expression were evaluated in total (lanes 1,2), mitochondrial (lanes 3,4) and cytosolic (lanes 5,6) fractions. Mitochondrial (VDAC), cytosol (GAPDH) and β-actin (total) are included as fractionation and loading controls. Myc expression after Drp1-myc transfection is shown in (E). Markers in kDa. (C, D, F) Cytochrome c protein expression normalized to β-actin in NL20 (white bars) and A549 (black bars) cell fractions under untreated conditions (C), 1 µM STS treatment for 3 h (D) or 1 µM STS treatment for 3 h with ectopic expression of Drp1-myc (F). Mean and SEM shown from two independent experiments. 2-way ANOVA analysis with Bonferroni post-tests. Mitochondrial morphology under these conditions is shown in Figure S3C and S5.
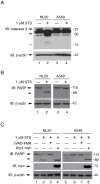
Figure 6. Resistance to STS-induced caspase-3 and PARP cleavage.
(A, B) NL20 and A549 cells treated with (lanes 2,4) and without (lanes 1,3) 1 µM STS for 3 hours to induce apoptosis. β-actin reprobe to show loading. Immunoblots show (A) endogenous caspase-3 protein expression; full length (arrow) and cleaved products (open or closed arrowhead). (B) Endogenous PARP protein expression; full length (arrow) and cleaved product (arrowhead). (C) Endogenous PARP protein expression; full length (arrow) and cleaved product (arrowhead) in NL20 and A549 cells treated with 50 µM zVAD-FMK (lanes 3,7) for 4 h to inhibit caspase activity in non-transfected (lanes 1–3, 5–7) or Drp1-myc transfected (lanes 4,8) cells or co-treatment with 1 µM STS for 3 h (lanes 2–4,6–8). (A–C) Markers in kDa.
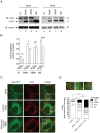
Figure 7. Impaired turnover of mitochondria prior to degradation by the lysosome.
(A) Representative immunoblot of LC3-I (arrow) to LC3-II (arrowhead) conversion in total protein from untreated (UT; lanes 1,5), 10 nM 24 h Bafilomycin A1 treated (BafA1; lanes 2,6) 24 h serum starved (EBSS; lanes 3,7) or combined 24 h BafA1/EBSS treated (B/E; lanes 4,8) NL20 and A549 cells. β-actin reprobe to show loading. (B) LC3-II quantification (normalized to β-actin) from two independent experiments. Cells conditions were as in (A) to examine differences between (B) cell lines. Mean and SEM shown, 2-way ANOVA analysis with Bonferroni post-test. (C) Mito-YFP transfection (left) and LC3 immunostaining (middle) in A549 cells show mitophagy by colocalization of LC3 with the mitochondria (merged, right). A549 cells treated with 10 µM CCCP for 30 minutes (middle) or transfected with Drp1-myc for 24 h and CCCP treated (bottom). Representative images of mitophagy by colocalization of mito-YFP and LC3 punctae (yellow expression) in CCCP and CCCP/Drp1-myc conditioned A549 cells. Scale bar is 2 µm. (D) Quantification of mitophagy as in (C). Box insets show enlarged microscopy sections to illustrate a selection of mitophagy events occurring (white open arrowheads) which are labeled 1–3 corresponding to original images as shown in (E); A549 (1), A549+CCCP (2), and A549+CCCP/Drp1-myc (3). Percent cell counts (>200) from three independent experiments were based on colocalization of LC3 punctae staining with mito-YFP (values represent mean number of punctae counts per cell binned with SEM). 2-way ANOVA analysis with Bonferroni post-tests.
Similar articles
- Gold nanoparticles enhance TRAIL sensitivity through Drp1-mediated apoptotic and autophagic mitochondrial fission in NSCLC cells.
Ke S, Zhou T, Yang P, Wang Y, Zhang P, Chen K, Ren L, Ye S. Ke S, et al. Int J Nanomedicine. 2017 Mar 31;12:2531-2551. doi: 10.2147/IJN.S129274. eCollection 2017. Int J Nanomedicine. 2017. PMID: 28408823 Free PMC article. - Dynamin-related protein 1-mediated mitochondrial fission contributes to IR-783-induced apoptosis in human breast cancer cells.
Tang Q, Liu W, Zhang Q, Huang J, Hu C, Liu Y, Wang Q, Zhou M, Lai W, Sheng F, Li G, Zhang R. Tang Q, et al. J Cell Mol Med. 2018 Sep;22(9):4474-4485. doi: 10.1111/jcmm.13749. Epub 2018 Jul 11. J Cell Mol Med. 2018. PMID: 29993201 Free PMC article. - Aβ-Induced Drp1 phosphorylation through Akt activation promotes excessive mitochondrial fission leading to neuronal apoptosis.
Kim DI, Lee KH, Gabr AA, Choi GE, Kim JS, Ko SH, Han HJ. Kim DI, et al. Biochim Biophys Acta. 2016 Nov;1863(11):2820-2834. doi: 10.1016/j.bbamcr.2016.09.003. Epub 2016 Sep 4. Biochim Biophys Acta. 2016. PMID: 27599716 - New insights into the function and regulation of mitochondrial fission.
Otera H, Ishihara N, Mihara K. Otera H, et al. Biochim Biophys Acta. 2013 May;1833(5):1256-68. doi: 10.1016/j.bbamcr.2013.02.002. Epub 2013 Feb 20. Biochim Biophys Acta. 2013. PMID: 23434681 Review. - [Mechanism of mitochondrial fission - structure and function of Drp1 protein].
Michalska B, Duszyński J, Szymański J. Michalska B, et al. Postepy Biochem. 2016;62(2):127-137. Postepy Biochem. 2016. PMID: 28132464 Review. Polish.
Cited by
- Bcl-2-enhanced efficacy of microtubule-targeting chemotherapy through Bim overexpression: implications for cancer treatment.
Savry A, Carre M, Berges R, Rovini A, Pobel I, Chacon C, Braguer D, Bourgarel-Rey V. Savry A, et al. Neoplasia. 2013 Jan;15(1):49-60. doi: 10.1593/neo.121074. Neoplasia. 2013. PMID: 23358890 Free PMC article. - Dengue virus induces mitochondrial elongation through impairment of Drp1-triggered mitochondrial fission.
Barbier V, Lang D, Valois S, Rothman AL, Medin CL. Barbier V, et al. Virology. 2017 Jan;500:149-160. doi: 10.1016/j.virol.2016.10.022. Epub 2016 Nov 4. Virology. 2017. PMID: 27816895 Free PMC article. - Role of Mitochondria in Physiology of Chondrocytes and Diseases of Osteoarthritis and Rheumatoid Arthritis.
Kan S, Duan M, Liu Y, Wang C, Xie J. Kan S, et al. Cartilage. 2021 Dec;13(2_suppl):1102S-1121S. doi: 10.1177/19476035211063858. Epub 2021 Dec 11. Cartilage. 2021. PMID: 34894777 Free PMC article. Review. - Heat shock protein B8 promotes proliferation and migration in lung adenocarcinoma A549 cells by maintaining mitochondrial function.
Yu LL, Wang Y, Xiao ZK, Chen SS. Yu LL, et al. Mol Cell Biochem. 2021 Jan;476(1):187-197. doi: 10.1007/s11010-020-03896-3. Epub 2020 Sep 14. Mol Cell Biochem. 2021. PMID: 32926297 - Drp1 splice variants regulate ovarian cancer mitochondrial dynamics and tumor progression.
Javed Z, Shin DH, Pan W, White SR, Elhaw AT, Kim YS, Kamlapurkar S, Cheng YY, Benson JC, Abdelnaby AE, Phaëton R, Wang HG, Yang S, Sullivan MLG, St Croix CM, Watkins SC, Mullett SJ, Gelhaus SL, Lee N, Coffman LG, Aird KM, Trebak M, Mythreye K, Walter V, Hempel N. Javed Z, et al. EMBO Rep. 2024 Oct;25(10):4281-4310. doi: 10.1038/s44319-024-00232-4. Epub 2024 Aug 27. EMBO Rep. 2024. PMID: 39191946 Free PMC article.
References
- Glinsky GV, Glinsky VV, Ivanova AB, Hueser CJ (1997) Apoptosis and metastasis: increased apoptosis resistance of metastatic cancer cells is associated with the profound deficiency of apoptosis execution mechanisms. Cancer Lett 115: 185–193. - PubMed
- Fulda S, Galluzzi L, Kroemer G (2010) Targeting mitochondria for cancer therapy. Nat Rev Drug Discov 9: 447–464. - PubMed
- Shivapurkar N, Reddy J, Chaudhary PM, Gazdar AF (2003) Apoptosis and lung cancer: a review. J Cell Biochem 88: 885–898. - PubMed
Publication types
MeSH terms
Substances
Grants and funding
St. Mary’s Hospital and Regional Medical Center, St. Mary’s Hospital Foundation. The funders had no role in study design, data collection and analysis, decision to publish, or preparation of the manuscript.
LinkOut - more resources
Full Text Sources
Medical
Research Materials
Miscellaneous
