EpiExplorer: live exploration and global analysis of large epigenomic datasets - PubMed (original) (raw)
EpiExplorer: live exploration and global analysis of large epigenomic datasets
Konstantin Halachev et al. Genome Biol. 2012.
Abstract
Epigenome mapping consortia are generating resources of tremendous value for studying epigenetic regulation. To maximize their utility and impact, new tools are needed that facilitate interactive analysis of epigenome datasets. Here we describe EpiExplorer, a web tool for exploring genome and epigenome data on a genomic scale. We demonstrate EpiExplorer's utility by describing a hypothesis-generating analysis of DNA hydroxymethylation in relation to public reference maps of the human epigenome. All EpiExplorer analyses are performed dynamically within seconds, using an efficient and versatile text indexing scheme that we introduce to bioinformatics. EpiExplorer is available at http://epiexplorer.mpi-inf.mpg.de.
Figures
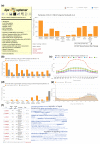
Figure 1
Utilizing EpiExplorer for interactive analysis and hypothesis generation. After uploading a set of published 5-hydroxymethylcytosine (5hmC) hotspots [35] into EpiExplorer, various options for genome-wide analysis are available. All diagrams are generated dynamically in response to user interactions. (a) Bar chart summarizing the percent overlap (y-axis) between 5hmC hotspots and various genomic datasets (x-axis) in H1hESC cells. (b) Bar chart comparing the percent overlap of 5hmC hotspots (orange) and randomized control regions (grey) with histone H3K4me1 peaks, based on ENCODE data [60]. (c) Genomic neighborhood plot illustrating the percent overlap (y-axis) with H3K4me1 peaks in the vicinity of 5hmC hotspots (x-axis). Different line colors correspond to H3K4me1 data for different cell types. (d) Bar chart comparing the percent overlap of 5hmC hotspots (orange) and randomized control regions (grey) with a comprehensive catalog of epigenetic states derived by computational segmentation of ENCODE histone modification data [39]. (e) Histogram illustrating the distribution of DNA methylation levels among 5hmC hotspots (orange) and randomized control regions (grey), based on Roadmap Epigenomics data [52]. (f) Enrichment table (left) and word cloud (right) illustrating the most highly enriched Gene Ontology (GO) terms among genes whose transcribed region is within 10 kb of a 5hmC hotspot. The most general (more than 5,000 associated genes) and most specific GO terms (less than 50 associated genes) were suppressed in this analysis.
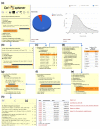
Figure 2
Dynamic filtering of epigenome data identifies candidate regions for further analysis. Using successive filtering steps, a genomic dataset with 82,221 hotspots of 5-hydroxymethylcytosine (5hmC) in human ES cells [35] is refined to a list of 16 regions that provide strong candidates for investigating the functional association between 5hmC and H3K4me1-marked enhancer elements. (a) Filtering with a minimum length threshold of 1 kb yields 5,734 genomic regions. (b) Filtering with a minimum 5hmC hotspot score threshold of 300, which corresponds to a detection significance of 10-30 or better, yields 2,535 genomic regions. (c) Filtering for overlap with H3K4me1 peaks in a human ES cell line (H1hESC) yields 2,334 genomic regions. (d) Filtering for association with genes that are annotated with any of the 1,608 Gene Ontology terms containing the word 'regulation' yields 1,064 genomic regions. (e) Filtering for overlap with an alternative dataset of 5hmC hotspots [44] yields 99 genomic regions. (f) Filtering for a minimum DNA methylation coverage threshold of five CpGs yields 65 genomic regions. (g) Filtering for intermediate DNA methylation with levels in the range of 20% to 50% yields 16 genomic regions. (h) EpiExplorer screenshot showing the final list of candidate regions, ready for visualization in a genome browser, for download and manual inspection, and for export to other web-based tools for further analysis.
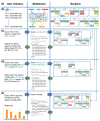
Figure 3
Efficient text search enables live exploration of genome-scale datasets. For three simple queries performed on a small set of genomic regions, this figure illustrates how EpiExplorer analyses are translated into text search queries, how these queries are run against a text index built from genomic data, how the responses are translated back into genome analysis results, and how the results are visualized in the user's web browser. (a) EpiExplorer's software architecture consists of three tiers: a web-based user interface, a middleware that translates between genomic analyses and text search queries, and a backend that efficiently retrieves matching regions for each query. (b) When a user uploads a genomic region set (here: chromosome, start and end position for ten regions named R1 to R10), the middleware annotates this region set with genome and epigenome data, encodes the results in a semi-structured text format, and launches a CompleteSearch server instance to host the corresponding search index. (c) To identify which regions overlap with a CpG island, a simple query overlap:CGI is sent to the backend, and the backend returns an XML file with the matching regions. (d) To identify regions that overlap with CpG islands as well as with H3K4me3 peaks, an AND search is performed (query: overlap:CGI overlap:H3K4me3), and the backend returns only regions that are annotated with both keywords. (e) To efficiently generate percent overlap diagrams, a prefix query overlap:* is sent to the backend, which identifies all possible completions of the prefix and returns the total number of regions matching each query completion.
Similar articles
- methylC Track: visual integration of single-base resolution DNA methylation data on the WashU EpiGenome Browser.
Zhou X, Li D, Lowdon RF, Costello JF, Wang T. Zhou X, et al. Bioinformatics. 2014 Aug 1;30(15):2206-7. doi: 10.1093/bioinformatics/btu191. Epub 2014 Apr 10. Bioinformatics. 2014. PMID: 24728854 Free PMC article. - WashU Epigenome Browser update 2022.
Li D, Purushotham D, Harrison JK, Hsu S, Zhuo X, Fan C, Liu S, Xu V, Chen S, Xu J, Ouyang S, Wu AS, Wang T. Li D, et al. Nucleic Acids Res. 2022 Jul 5;50(W1):W774-W781. doi: 10.1093/nar/gkac238. Nucleic Acids Res. 2022. PMID: 35412637 Free PMC article. - WashU Epigenome Browser update 2019.
Li D, Hsu S, Purushotham D, Sears RL, Wang T. Li D, et al. Nucleic Acids Res. 2019 Jul 2;47(W1):W158-W165. doi: 10.1093/nar/gkz348. Nucleic Acids Res. 2019. PMID: 31165883 Free PMC article. - Mapping human epigenomes.
Rivera CM, Ren B. Rivera CM, et al. Cell. 2013 Sep 26;155(1):39-55. doi: 10.1016/j.cell.2013.09.011. Cell. 2013. PMID: 24074860 Free PMC article. Review. - Epigenomics in stress tolerance of plants under the climate change.
Kumar M, Rani K. Kumar M, et al. Mol Biol Rep. 2023 Jul;50(7):6201-6216. doi: 10.1007/s11033-023-08539-6. Epub 2023 Jun 9. Mol Biol Rep. 2023. PMID: 37294468 Review.
Cited by
- DNA methylation analysis of phenotype specific stratified Indian population.
Rotti H, Mallya S, Kabekkodu SP, Chakrabarty S, Bhale S, Bharadwaj R, Bhat BK, Dedge AP, Dhumal VR, Gangadharan GG, Gopinath PM, Govindaraj P, Joshi KS, Kondaiah P, Nair S, Nair SN, Nayak J, Prasanna BV, Shintre P, Sule M, Thangaraj K, Patwardhan B, Valiathan MV, Satyamoorthy K. Rotti H, et al. J Transl Med. 2015 May 8;13:151. doi: 10.1186/s12967-015-0506-0. J Transl Med. 2015. PMID: 25952924 Free PMC article. - BioMethyl: an R package for biological interpretation of DNA methylation data.
Wang Y, Franks JM, Whitfield ML, Cheng C. Wang Y, et al. Bioinformatics. 2019 Oct 1;35(19):3635-3641. doi: 10.1093/bioinformatics/btz137. Bioinformatics. 2019. PMID: 30799505 Free PMC article. - Open source libraries and frameworks for biological data visualisation: a guide for developers.
Wang R, Perez-Riverol Y, Hermjakob H, Vizcaíno JA. Wang R, et al. Proteomics. 2015 Apr;15(8):1356-74. doi: 10.1002/pmic.201400377. Epub 2015 Feb 5. Proteomics. 2015. PMID: 25475079 Free PMC article. Review. - What can epigenomics do for you?
Meissner A. Meissner A. Genome Biol. 2012 Oct 23;13(10):420. doi: 10.1186/gb-2012-13-10-420. Genome Biol. 2012. PMID: 23095436 Free PMC article. No abstract available. - Integrating Epigenomics into the Understanding of Biomedical Insight.
Han Y, He X. Han Y, et al. Bioinform Biol Insights. 2016 Dec 4;10:267-289. doi: 10.4137/BBI.S38427. eCollection 2016. Bioinform Biol Insights. 2016. PMID: 27980397 Free PMC article. Review.
References
- Adams D, Altucci L, Antonarakis SE, Ballesteros J, Beck S, Bird A, Bock C, Boehm B, Campo E, Caricasole A, Dahl F, Dermitzakis ET, Enver T, Esteller M, Estivill X, Ferguson-Smith A, Fitzgibbon J, Flicek P, Giehl C, Graf T, Grosveld F, Guigo R, Gut I, Helin K, Jarvius J, Kuppers R, Lehrach H, Lengauer T, Lernmark A, Leslie D. et al.BLUEPRINT to decode the epigenetic signature written in blood. Nat Biotechnol. 2012;30:224–226. doi: 10.1038/nbt.2153. - DOI - PubMed
- Bernstein BE, Stamatoyannopoulos JA, Costello JF, Ren B, Milosavljevic A, Meissner A, Kellis M, Marra MA, Beaudet AL, Ecker JR, Farnham PJ, Hirst M, Lander ES, Mikkelsen TS, Thomson JA. The NIH Roadmap Epigenomics Mapping Consortium. Nat Biotechnol. 2010;28:1045–1048. doi: 10.1038/nbt1010-1045. - DOI - PMC - PubMed
Publication types
MeSH terms
LinkOut - more resources
Full Text Sources
Other Literature Sources


