Mitotic motors coregulate microtubule patterns in axons and dendrites - PubMed (original) (raw)
Mitotic motors coregulate microtubule patterns in axons and dendrites
Shen Lin et al. J Neurosci. 2012.
Abstract
Microtubules are nearly uniformly oriented in the axons of vertebrate neurons but are non-uniformly oriented in their dendrites. Studies to date suggest a scenario for establishing these microtubule patterns whereby microtubules are transported into the axon and nascent dendrites with plus-ends-leading, and then additional microtubules of the opposite orientation are transported into the developing dendrites. Here, we used contemporary tools to confirm that depletion of kinesin-6 (also called CHO1/MKLP1 or kif23) from rat sympathetic neurons causes a reduction in the appearance of minus-end-distal microtubules in developing dendrites, which in turn causes them to assume an axon-like morphology. Interestingly, we observed a similar phenomenon when we depleted kinesin-12 (also called kif15 or HKLP2). Both motors are best known for their participation in mitosis in other cell types, and both are enriched in the cell body and dendrites of neurons. Unlike kinesin-12, which is present throughout the neuron, kinesin-6 is barely detectable in the axon. Accordingly, depletion of kinesin-6, unlike depletion of kinesin-12, has no effect on axonal branching or navigation. Interestingly, depletion of either motor results in faster growing axons with greater numbers of mobile microtubules. Based on these observations, we posit a model whereby these two motors generate forces that attenuate the transport of microtubules with plus-ends-leading from the cell body into the axon. Some of these microtubules are not only prevented from moving into the axon but are driven with minus-ends-leading into developing dendrites. In this manner, these so-called "mitotic" motors coregulate the microtubule patterns of axons and dendrites.
Figures
Figure 1.
Kinesin-6 is expressed in the CNS and PNS during development. A, Schematic representation showing kinesin-6 with its motor domain, neck-linker, actin-binding domain, and nuclear localization sites. The new monoclonal kinesin-6 antibody (ML-6) recognizes a site within the actin-binding domain of the CHO1 protein. B, Immunolabeling of RFL-6 rat fibroblast with the ML-6 antibody reveals strong signal in the midbody region during the final stage of cell division (and also in midzonal regions in earlier phases of mitosis; data not shown). Scale bar, 10 μm. C, Western blot of kinesin-6 (using the ML-6 antibody) in rat cortex brain lysate at E18, P1, P6, P14, P30, and adult (Ad). D, Western blot of kinesin-6 (using the ML-6 antibody) in rat SCG lysate at E18, P1, P3, P6, P14, P30, and adult. The band detected by ML-6 migrates at 105 kDa (top row), whereas the band detected by the monoclonal GAPDH antibody, internal control, migrates at 37 kDa (bottom row). Levels of kinesins-6 revealed with the ML-6 antibody were expressed as densitometric ratios with GAPDH for each group. Kinesin-6 protein expression decreases during development in the cortex and SCG with a greater decrease in the cortex compared with SCG. Horizontal axis represents days before and after birth. Similar results were obtained with the SL-6 antibody (data not shown).
Figure 2.
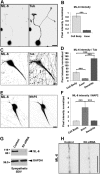
Kinesin-6 distribution in neurons. SCG neurons were cultured for 24 h or 7 DIV, fixed with cold methanol, and double labeled with ML-6 and the β-III tubulin (Tub) antibodies (A–D) or double labeled with ML-6 and MAP2 antibodies (E, F). Fluorescence images are presented in an inverted format that converts blacks to whites and whites to blacks and inverts gray levels proportionally. A, At 24 h, ML-6 strongly labels the cell body, but labeling in the axon is barely detectable. Scale bar, 10 μm. B, Quantification of ML-6 labeling intensity in axons shows very little signal in the axon relative to the cell body. Data are represented as mean ± SEM intensity ratio (relative to β-III tubulin, minus the secondary antibody background): cell body intensity = 0.84 ± 0.07; axon intensity = 0.12 ± 0.01 (n = 20, p < 0.001). C, At 7 DIV, ML-6 localizes strongly to the cell body and dendrites, but axons remain dim by comparison. Scale bar, 20 μm. D, Quantification of ML-6 labeling intensity ratioed to β-III tubulin shows significantly higher cell body labeling than axonal labeling and significantly higher dendritic labeling than cell body labeling. Data are represented as mean ± SEM intensity ratio ML-6/β-III tubulin (minus the secondary antibody background): cell body intensity = 54.61 ± 4.70 (n = 23); axon intensity = 14.76 ± 1.44 (n = 23, p < 0.001); dendrite intensity = 144.12 ± 14.00 (n = 23, p < 0.001). E, At 7 DIV, neurons double labeled for MAP2 and ML-6 show somatodendritic enrichment of both, with the compartmentation appearing to be somewhat more robust for MAP2 than kinesin-6. Scale bar, 20 μm. F, Quantification of ML-6 labeling intensity ratioed to MAP2 shows significantly greater MAP2 labeling in axons compared with cell bodies or dendrites. Data are represented as mean ± SEM intensity ratio ML-6/MAP2 (minus the secondary antibody background): axon intensity = 3.95 ± 0.98 (n = 20); cell body intensity = 1.03 ± 0.09 (n = 20, p < 0.001); dendrite intensity = 1.09 ± 0.12 (n = 20, p < 0.001). G, The 5 DIV cultures transfected with either control siRNA or kinesin-6 siRNA at plating and collected for Western blot analysis. Blots probed with SL-6 show that kinesin-6 remained thoroughly depleted at 5 DIV. Comparable results were obtained with the ML-6 antibody (data not shown). Note that the SL-6 antibody produces a single band in rat neurons, indicating that the MKLP1 isoform of kinesin-6 is not expressed in neurons or expressed at levels beneath detection. H, Magnified (inverted) images of axonal regions of a control siRNA neuron and a kinesin-6 siRNA neuron labeled with ML-6. Intensity is only marginally lower in the latter compared with the former, suggesting that the faint signal observed in axons may be attributable at least in part to nonspecificity in the primary antibody, when used for immunolabeling. Scale bar, 5 μm.
Figure 3.
Neurons depleted of kinesin-6 or kinesin-12 extend experimental dendrites that are thinner and longer than control dendrites. A, Schematic shows how the CX1 device is used to transfect adherent neurons at 5 DIV. 1, The capillary is filled with transfection solution containing DNA and siRNA. 2, The capillary is lowered into the dish containing adherent neurons. 3, The pump is activated and ejects the DNA, siRNA, and transfection solution mixture. 4, Multiple electrical pulses are applied to the capillary; these pulses activate an electrical charge to the surrounding cells. 5, This opens up the cell membrane to permit entry of the DNA and siRNA, thus transfecting the cells in the region around the capillary. B, Neurons transfected at the time of plating using nucleofection and again at 5 DIV on plated neurons using a Cellaxess CX1 system. Control, kinesin-6, or kinesin-12 siRNA was introduced at both transfections, at the time of plating and at the second transfection together with EGFP to indicate which neurons were transfected. Cells were fixed in formaldehyde and glutaraldehyde and then fluorescently labeled with MAP2 immunolabeling and phalloidin. Fluorescence images are presented in an inverted format that converts blacks to whites and whites to blacks and inverts gray levels proportionally. Scale bar, 20 μm. C, The mean dendritic width along the first 100 μm from the cell body was determined in SCG neuronal cultures that had been twice transfected with control siRNA (n = 30), kinesin-6 siRNA (n = 25), or kinesin-12 siRNA (n = 18) at 7 DIV (see Table 1). The dendritic width of neurons transfected with kinesin-6 siRNA was significantly smaller than control neurons for the first 60 μm. The dendritic width of neurons transfected with kinesin-12 siRNA was significantly smaller than in control neurons up to and beyond 100 μm. D, The proportion of experimental dendrites that grew longer than 150 μm (orange and red) increased in kinesin-6 siRNA (20%) and in kinesin-12 siRNA (20%) compared with control cultures (4.3%); n = 20.
Figure 4.
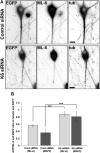
Depletion of kinesin-6 causes MAP2 and residual ML-6 immunolabeling to become redistributed in the neuron. SCG neurons were transfected with siRNA at plating and then with EGFP and control or kinesin-6 siRNA at 5 DIV using the CX1 device. Neurons were fixed in methanol at 7 DIV and double labeled with ML-6 and β-III tubulin (tub). Fluorescence images are presented in an inverted format that converts blacks to whites and whites to blacks and inverts gray levels proportionally. A, At 7 DIV, neurons transfected with control siRNA exhibited thick dendrite morphology, whereas neurons transfected with kinesin-6 siRNA only exhibited thin experimental dendrites. B, Quantification of the mean ADR in neurons double labeled with ML-6 and β-III-tubulin or ML-6 and MAP2 at 7 DIV. Data are represented as mean ADR (see Materials and Methods), in which ADR for ML-6 is significantly lower in control neurons than kinesin-6-depleted neurons. In control neurons, ML-6.ADR = 0.56 ± 0.04. In cultures depleted of kinesin-6, ML-6.ADR = 0.88 ± 0.08, (n = 30; p < 0.001). In control neurons, MAP2.ADR = 0.36 ± 0.08. In cultures depleted of kinesin-6, MAP2.ADR = 0.81 ± 0.15 (n = 20; p < 0.001).
Figure 5.
Experimental dendrites of neurons depleted of kinesin-6 or kinesin-12 have fewer minus-end-distal microtubules than control dendrites. SCG neurons were transfected with control, kinesin-6, or kinesin-12 siRNA at the time of plating and again at 5 DIV with EGFP–EB3 together with an siRNA boost before being imaged at 7 DIV. A, The number of forward-moving EB3 comets in dendrites (or “experimental dendrites”), corresponding to plus-end-distal microtubules (green arrows), and the number of backward-moving EB3 comets in dendrites, corresponding to minus-end-distal microtubules (red arrows), were quantified. Top panels show representative dendrites or experimental dendrites of neurons transfected with EGFP–EB3 in each condition. Bottom panels show magnified images of the inset box area for each corresponding dendrite or experimental dendrite, with representative arrows indicating the direction of EGFP–EB3 comet movement in one representative frame of a movie. There is a greater proportion of forward-moving EB3 comets in dendrites of kinesin-6 or kinesin-12 siRNA transfected neurons compared with neurons transfected with control siRNA. Scale bar, 10 μm. B, The percentage of backward-moving comets in experimental dendrites of kinesin-6- or kinesin-12-depleted neurons was significantly lower than the percentage in control dendrites (n = 25). This is true in the proximal, middle, and distal portion of the dendrite. Data are represented as mean ± SEM percentage: control (proximal) = 35.79 ± 2.08; control (middle) = 36.76 ± 2.01; control (distal) = 34.94 ± 1.50; kinesin-6 siRNA (proximal) = 22.30 ± 2.37; kinesin-6 siRNA (middle) = 25.22 ± 1.96; kinesin-6 siRNA (distal) = 25.97 ± 2.27; kinesin-12 siRNA (proximal) = 22.93 ± 1.67 (p < 0.001); kinesin-12 siRNA (middle) = 24.23 ± 2.68; kinesin-12 siRNA (distal) = 23.46 ± 2.04 (p < 0.001). C, Kymographs show that, in the dendrites of control neurons, many EGFP–EB3 comets move in either the forward or backward direction, whereas in the experimental dendrites of neurons depleted of kinesin-6 or kinesin-12 with siRNA, relatively more comets move in the forward direction. Green arrows mark the forward-moving comets (negative slope traces). Red arrows mark backward-moving comets (positive slope traces). Scale bar, 10 μm.
Figure 6.
Depletion of kinesin-6 significantly increases axonal length. SCG cells were transfected with control or kinesin-6 siRNA before plating and were grown for 3 DIV before replating. Replated neurons were grown for another 24 or 31 h before fixation and immunolabeling for β-III tubulin. No laminin was included in the replated cultures because slower-growing axons were found to be easier to quantify in terms of axonal length and other morphometric parameters. Fluorescence images are presented in an inverted format that converts blacks to whites and whites to blacks and inverts gray levels proportionally. A, Control siRNA. B, Kinesin-6 siRNA. Scale bar: 20 μm. C, The mean length of neurons transfected with kinesin-6 siRNA was significantly longer than axons in control neurons. Data are represented as mean ± SEM length: control siRNA = 115.9 ± 9.7 μm (24 h), 160.9 ± 12.7 μm (31 h); kinesin-6 siRNA = 214.3 ± 17.6 μm (24 h), 277.7 ± 22.2 μm (31 h) (n = 30, p < 0.001). The mean total axonal lengths in kinesin-6 siRNA-treated cultures were also significantly longer than in controls: control siRNA = 292 ± 32.4 μm (24 h), 696.5 ± 65.2 μm (31 h); kinesin-6 siRNA = 586.9 ± 63.8 μm (24 h, p < 0.001), 1233.9 ± 148.1 μm (31 h) (n = 35, p < 0.001). D, Quantification of axonal morphology shows that kinesin-6 siRNA has no detectable effect on branching or initiation of axons. Data are represented as mean ± SEM number of axons: control siRNA = 2.2 ± 0.4; kinesin-6 siRNA = 2.4 ± 0.5 (n = 10). Mean number of primary branches formed per 100 μm: control siRNA = 1.25 ± 0.10; kinesin-6 siRNA = 1.16 ± 0.20 (n = 10). Mean number of secondary branches formed per 100 μm: control siRNA = 0.49 ± 0.06; kinesin-6 siRNA = 0.66 ± 0.17 (n = 10).
Figure 7.
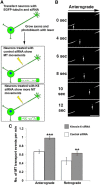
Depletion of kinesin-6 increases the frequency of microtubule transport in axons. A, SCGs were transfected with EGFP–tubulin together with control or kinesin-6 siRNA just before plating. At 3 DIV, neurons were replated and axons were allowed to grow anew for 48 h. Laminin was included in these cultures because faster-growing axons were generally thinner and therefore better suited for the microtubule transport assay. Microtubule transport events were more frequent in neurons transfected with kinesin-6 siRNA. B, A bleached zone of ∼30 μm was made at a distance of 50–100 μm from the cell body using a laser, and the frequency of short fluorescent microtubules moving through the zone during a period of 6 min was noted. Scale bar, 5 μm. C, Frequency of anterograde and retrograde microtubule transport (transport events per minute) in kinesin-6 siRNA cultures was significantly higher than in control cultures. Data are represented as mean ± SEM number of events: anterograde transport, control siRNA = 1.05 ± 0.05; kinesin-6 siRNA = 0.61 ± 0.06 (n = 20, p < 0.001); retrograde transport, control siRNA = 0.47 ± 0.05; kinesin-6 siRNA = 0.57 ± 0.06 (n = 16, p < 0.01).
Figure 8.
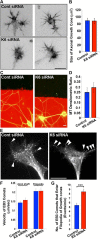
Depletion of kinesin-6 has no detectable effect on axonal branching or growth cone turning. A, Representative images of axonal growth cones labeled with fluorescent phalloidin in control and kinesin-6-depleted neurons. Fluorescence images are presented in an inverted format that converts blacks to whites and whites to blacks and inverts gray levels proportionally. Scale bar, 20 μm. B, Quantification of mean growth cone area (performed on samples labeled with fluorescent phalloidin) showed no significant difference between the groups. Data represented by mean ± SEM growth cone area: control siRNA = 88.86 ± 7.67 μm2; kinesin-6 siRNA = 87.88 ± 8.17 μm2. C, Representative images of axons growing on a laminin substrate (red) and turning away from the border between the laminin and a poly-
d
-lysine substrate (black). D, Quantification of the ratio of microtubule fluorescence on the laminin side and poly-
d
-lysine side showed no significant difference between control siRNA (0.25 ± 0.04) and kinesin-6-depleted (0.29 ± 0.05) neurons. Scale bar, 10 μm. n = 20. E, Representative growth cones of neurons transfected with EGFP–EB3 and control or kinesin-6 siRNA. White arrowheads indicate EB3 comets entering the filopodia, in which one arrowhead is shown in the control growth cone and three are indicated entering the kinesin-6-depleted growth cone. Scale bar, 10 μm. F, Quantification of the velocity of EB3 comets that travel through the axonal shaft shows no significant difference between groups. Data represented as mean ± SEM velocity: control siRNA = 0.14 ± 0.01 μm/s (n = 29); kinesin-6 siRNA = 0.16 ± 0.01 μm/s (n = 28); and through the filopodia, control siRNA = 0.21 ± 0.01 μm/s (n = 22); kinesin-6 siRNA = 0.21 ± 0.02 μm/s (n = 25). G, Quantification of the number of EB3 comets entering filopodia in the growth cones shows greater numbers in the case of kinesin-6-depleted neurons. Data are represented as mean ± SEM number: control siRNA = 5.36 ± 0.51 (n = 22); kinesin-6 siRNA = 8.43 ± 0.61 (n = 22, p < 0.001).
Figure 9.
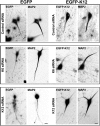
EGFP–kinesin-6 expression does not localize to dendrites. Full-length EGFP–kinesin-6 expressed in 7 DIV SCG neurons appears predominantly or exclusively in the nucleus (left). EGFP–kinesin-6 mutated at S904A/S905A or the EGFP–kinesin-6 with a deleted nuclear localization domain appears predominantly in the distal axon (middle). EGFP–kinesin-12 concentrates in the cell body and dendrites (right). Scale bar, 10 μm.
Figure 10.
Expression of EGFP–kinesin-12 rescues axonal phenotype of kinesin-6 or kinesin-12 siRNA. Expression of EGFP–kinesin-12 significantly reduces the mean longest axonal length in all cultures. SCG neurons were transfected with siRNA at plating and replated at 3 DIV, when control empty EGFP plasmid or EGFP–kinesin-12 was introduced by transfection. Neurons were left to grow axons for 10 h. The mean longest axonal length of neurons transfected with EGFP was significantly shorter than neurons transfected with EGFP–kinesin-12. Data are represented as mean ± SEM length: control siRNA = 49.76 ± 13.15 μm; EGFP–kinesin-12 + control siRNA = 10.93 ± 4.85 μm (n = 24, p < 0.01). After kinesin-6 and kinesin-12 depletion, the mean longest axonal length of neurons transfected with EGFP–kinesin-12 was also significantly decreased relative to those expressing EGFP. Kinesin-6 siRNA = 77.92 ± 12.54 μm; EGFP–kinesin-12 + kinesin-6 siRNA = 10.07 ± 3.51 μm (n = 34, p < 0.001); kinesin-12 siRNA = 146.94 ± 16.13 μm; EGFP–kinesin-12 + kinesin-12 siRNA = 71.18 ± 17.09 μm (n = 36, p < 0.001).
Figure 11.
Expression of EGFP–kinesin-12 rescues dendritic phenotype of kinesin-6 or kinesin-12 siRNA. SCG neurons were transfected with control, kinesin-6 siRNA, or kinesin-12 siRNA at the time of plating. At 5 DIV, neurons were transfected using the CX1 device with either EGFP empty plasmid or EGFP–kinesin-12 and the corresponding siRNA before being fixed at 7 DIV in methanol and immunolabeled for MAP2. Fluorescence images are presented in an inverted format that converts blacks to whites and whites to blacks and inverts gray levels proportionally. Representative images of dendrites transfected with control siRNA (top row), kinesin-6 siRNA (middle row), and kinesin-12 siRNA (bottom row). Neurons transfected with empty EGFP plasmid are shown on the left panels and neurons transfected with EGFP–kinesin-12 are shown on the right panels. Scale bar, 20 μm.
Figure 12.
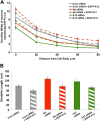
Expression of EGFP–kinesin-12 rescues dendritic width phenotype of kinesin-6 or kinesin-12 siRNA. A, The mean dendritic width along the first 80 μm from the cell body was determined in SCG cultures transfected with EGFP together with control (gray solid line, n = 20), kinesin-6 siRNA (red solid line, n = 20), and kinesin-12 siRNA (green solid line, n = 25) or with EGFP–kinesin-12 together with control siRNA (gray dashed line, n = 22), kinesin-6 siRNA (red dashed line, n = 23), and kinesin-12 siRNA (green dashed line, n = 25) (see Table 2). EGFP–kinesin-12 expression significantly increased the mean dendritic width in both kinesin-6-depleted and kinesin-12-depleted SCG neurons. EGFP–kinesin-12 expression does not significantly increase dendritic width of control neurons. Dendritic width of neurons transfected with EGFP–kinesin-12 after kinesin-6 depletion was significantly higher at all points along the dendrite compared with neurons transfected with EGFP–kinesin-12 after kinesin-12 depletion. B, Quantification of the mean length of dendrites showed that dendrites were significantly shorter in EGFP–kinesin-12-expressing neurons. Data are represented as mean ± SEM length: control siRNA (gray solid box) = 98.64 ± 6.17 μm (n = 22); EGFP–kinesin-12 + control siRNA (gray dashed box) = 78.69 ± 8.16 μm (p < 0.05, n = 24). In neurons depleted of kinesin-6, EGFP–kinesin-12 expression significantly decreased dendritic length: kinesin-6 siRNA (red solid box) = 128.02 ± 8.34 μm (n = 24); EGFP–kinesin-12 + kinesin-6 siRNA (red dashed box) = 96.55 ± 9.00 μm (p < 0.01, n = 26). In neurons depleted of kinesin-12, EGFP–kinesin-12 expression significantly decreased dendritic length: kinesin-12 siRNA (green solid box) = 116.78 ± 9.20 μm (n = 24); EGFP–kinesin-12 + kinesin-12 siRNA (green dashed box) = 91.91 ± 7.18 μm (n = 32, p < 0.01).
Figure 13.
Model for coregulation of microtubule polarity in axons and dendrites by different mitotic kinesins. During axonal differentiation, forces generated by cytoplasmic dynein drive plus-end-distal microtubules into the axon and nascent dendrites (data not shown). Left, Forces generated by kinesin-6 in the cell body oppose the forces generated by cytoplasmic dynein, restricting the transport of plus-end-distal microtubules into the axon. As the neuron matures, kinesin-6 fuels the transport of short microtubules with their minus-end distal into all of the processes except the one designated to remain the axon, thus causing the other processes to differentiate into dendrites. Right; Forces generated by kinesin-12 behave similarly to kinesin-6 with regard to introducing minus-end-distal microtubules into the dendrite, but kinesin-12 is also present in the axon and growth cone, pushing plus-end-distal microtubules back toward the cell body. As a result, kinesin-12 behaves like kinesin-6 with regard to dendrites but produces effects more like kinesin-5 with regard to the axon.
Similar articles
- Depletion of a microtubule-associated motor protein induces the loss of dendritic identity.
Yu W, Cook C, Sauter C, Kuriyama R, Kaplan PL, Baas PW. Yu W, et al. J Neurosci. 2000 Aug 1;20(15):5782-91. doi: 10.1523/JNEUROSCI.20-15-05782.2000. J Neurosci. 2000. PMID: 10908619 Free PMC article. - Expression of a minus-end-directed motor protein induces Sf9 cells to form axon-like processes with uniform microtubule polarity orientation.
Sharp DJ, Kuriyama R, Essner R, Baas PW. Sharp DJ, et al. J Cell Sci. 1997 Oct;110 ( Pt 19):2373-80. doi: 10.1242/jcs.110.19.2373. J Cell Sci. 1997. PMID: 9410876 - The role of motor proteins in establishing the microtubule arrays of axons and dendrites.
Baas PW. Baas PW. J Chem Neuroanat. 1998 Jun;14(3-4):175-80. doi: 10.1016/s0891-0618(98)00012-x. J Chem Neuroanat. 1998. PMID: 9704896 Review. - Dendrites In Vitro and In Vivo Contain Microtubules of Opposite Polarity and Axon Formation Correlates with Uniform Plus-End-Out Microtubule Orientation.
Yau KW, Schätzle P, Tortosa E, Pagès S, Holtmaat A, Kapitein LC, Hoogenraad CC. Yau KW, et al. J Neurosci. 2016 Jan 27;36(4):1071-85. doi: 10.1523/JNEUROSCI.2430-15.2016. J Neurosci. 2016. PMID: 26818498 Free PMC article. - Differentiation between Oppositely Oriented Microtubules Controls Polarized Neuronal Transport.
Tas RP, Chazeau A, Cloin BMC, Lambers MLA, Hoogenraad CC, Kapitein LC. Tas RP, et al. Neuron. 2017 Dec 20;96(6):1264-1271.e5. doi: 10.1016/j.neuron.2017.11.018. Epub 2017 Nov 30. Neuron. 2017. PMID: 29198755 Free PMC article. Review.
Cited by
- Pavarotti/MKLP1 regulates microtubule sliding and neurite outgrowth in Drosophila neurons.
Del Castillo U, Lu W, Winding M, Lakonishok M, Gelfand VI. Del Castillo U, et al. Curr Biol. 2015 Jan 19;25(2):200-205. doi: 10.1016/j.cub.2014.11.008. Epub 2014 Dec 31. Curr Biol. 2015. PMID: 25557664 Free PMC article. - APC2 controls dendrite development by promoting microtubule dynamics.
Kahn OI, Schätzle P, van de Willige D, Tas RP, Lindhout FW, Portegies S, Kapitein LC, Hoogenraad CC. Kahn OI, et al. Nat Commun. 2018 Jul 17;9(1):2773. doi: 10.1038/s41467-018-05124-5. Nat Commun. 2018. PMID: 30018294 Free PMC article. - An in vitro model of neuronal ensembles.
Rabadan MA, De La Cruz ED, Rao SB, Chen Y, Gong C, Crabtree G, Xu B, Markx S, Gogos JA, Yuste R, Tomer R. Rabadan MA, et al. Nat Commun. 2022 Jun 9;13(1):3340. doi: 10.1038/s41467-022-31073-1. Nat Commun. 2022. PMID: 35680927 Free PMC article. - The Kinesin Adaptor Calsyntenin-1 Organizes Microtubule Polarity and Regulates Dynamics during Sensory Axon Arbor Development.
Lee TJ, Lee JW, Haynes EM, Eliceiri KW, Halloran MC. Lee TJ, et al. Front Cell Neurosci. 2017 Apr 20;11:107. doi: 10.3389/fncel.2017.00107. eCollection 2017. Front Cell Neurosci. 2017. PMID: 28473757 Free PMC article. - Microtubules and Growth Cones: Motors Drive the Turn.
Kahn OI, Baas PW. Kahn OI, et al. Trends Neurosci. 2016 Jul;39(7):433-440. doi: 10.1016/j.tins.2016.04.009. Epub 2016 May 24. Trends Neurosci. 2016. PMID: 27233682 Free PMC article. Review.
References
- Ahmad FJ, Baas PW. Microtubules released from the neuronal centrosome are transported into the axon. J Cell Sci. 1995;108:2761–2769. - PubMed
- Ahmad FJ, He Y, Myers KA, Hasaka TP, Francis F, Black MM, Baas PW. Effects of dynactin disruption and dynein depletion on axonal microtubules. Traffic. 2006;7:524–537. - PubMed
- Baas PW. Microtubules and neuronal polarity: lessons from mitosis. Neuron. 1999;22:23–31. - PubMed
Publication types
MeSH terms
Substances
LinkOut - more resources
Full Text Sources

