Uric acid induces hepatic steatosis by generation of mitochondrial oxidative stress: potential role in fructose-dependent and -independent fatty liver - PubMed (original) (raw)
. 2012 Nov 23;287(48):40732-44.
doi: 10.1074/jbc.M112.399899. Epub 2012 Oct 3.
Laura G Sanchez-Lozada, Yea-Jin Choi, Christina Cicerchi, Mehmet Kanbay, Carlos A Roncal-Jimenez, Takuji Ishimoto, Nanxing Li, George Marek, Murat Duranay, George Schreiner, Bernardo Rodriguez-Iturbe, Takahiko Nakagawa, Duk-Hee Kang, Yuri Y Sautin, Richard J Johnson
Affiliations
- PMID: 23035112
- PMCID: PMC3504786
- DOI: 10.1074/jbc.M112.399899
Uric acid induces hepatic steatosis by generation of mitochondrial oxidative stress: potential role in fructose-dependent and -independent fatty liver
Miguel A Lanaspa et al. J Biol Chem. 2012.
Abstract
Background: Uric acid is an independent risk factor in fructose-induced fatty liver, but whether it is a marker or a cause remains unknown.
Results: Hepatocytes exposed to uric acid developed mitochondrial dysfunction and increased de novo lipogenesis, and its blockade prevented fructose-induced lipogenesis.
Conclusion: Rather than a consequence, uric acid induces fatty liver
Significance: Hyperuricemic people are more prone to develop fructose-induced fatty liver. Metabolic syndrome represents a collection of abnormalities that includes fatty liver, and it currently affects one-third of the United States population and has become a major health concern worldwide. Fructose intake, primarily from added sugars in soft drinks, can induce fatty liver in animals and is epidemiologically associated with nonalcoholic fatty liver disease in humans. Fructose is considered lipogenic due to its ability to generate triglycerides as a direct consequence of the metabolism of the fructose molecule. Here, we show that fructose also stimulates triglyceride synthesis via a purine-degrading pathway that is triggered from the rapid phosphorylation of fructose by fructokinase. Generated AMP enters into the purine degradation pathway through the activation of AMP deaminase resulting in uric acid production and the generation of mitochondrial oxidants. Mitochondrial oxidative stress results in the inhibition of aconitase in the Krebs cycle, resulting in the accumulation of citrate and the stimulation of ATP citrate lyase and fatty-acid synthase leading to de novo lipogeneis. These studies provide new insights into the pathogenesis of hepatic fat accumulation under normal and diseased states.
Figures
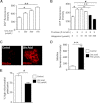
FIGURE 1.
Uric acid mediates fructose-induced fat accumulation in HepG2 cells. A, intracellular TG levels (in mg of normalized to g of soluble protein) in control and fructose-exposed cells (from 0 to 20 mmol/liter) for 72 h. B, intracellular uric acid levels in control and fructose-exposed cells (from 0 to 20 mmol/liter) for 72 h. C, AMPD activity in control and fructose-exposed cells (from 0 to 20 mmol/liter) for 72 h. D, intracellular uric acid levels in fructose (5 mmol/liter) and fructose + allopurinol (100 μmol/liter)-exposed cells for 72 h. E, intracellular TG levels (mg/g of soluble protein) in fructose (5 mmol/liter) and fructose + allopurinol (100 μmol/liter)-exposed cells for 72 h. *, p < 0.05; **, p < 0.01; ***, p < 0.001; §§, p < 0.01 versus 0 h; §§§, p < 0.001 versus 0 h.
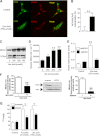
FIGURE 2.
Uric acid induces fat accumulation in HepG2 cells independently of fructose metabolism. A, concentration of TG (in milligrams normalized to gram of soluble protein) in extracts from cells exposed to different amounts of uric acid for 72 h. B, representative image of Oil Red-O staining of HepG2 cells control or exposed to uric acid (750 μmol/liter). C, concentration of TG (milligrams/g of soluble protein) in control (1st column) or KHK-deficient cells (2nd to 6th columns) exposed to fructose (blue column) or different amounts of uric acid (black columns). D, concentration of TG (milligrams/g of soluble protein) in control (1st column) or AldoB-deficient cells (columns 2–6) exposed to fructose (blue column) or different amounts of uric acid (black columns). E, concentration of uric acid (micrograms/g of soluble protein) in control, KHK-deficient, or AldoB-deficient cells exposed to fructose. F, KHK expression in control or AldoB-deficient cells exposed to fructose. *, p < 0.05; **, p < 0.01; ***, p < 0.001.
FIGURE 3.
Uric acid induces superoxide generation and mitochondrial dysfunction in HepG2 cells. A, cellular oxidative stress as measured with the fluorescent dye DCF in cells exposed to increasing levels of uric acid (from 0 to 750 μmol/liter). B, cellular oxidative stress as measured with the fluorescent dye DCF in cells exposed to 5 mmol/liter fructose in the presence or absence of different amounts of allopurinol (from 0 to 500 μmol/liter) Black columns represent allopurinol concentrations that have a significant effect compared with fructose alone. C, representative image of mitochondrial superoxide generation as measured with the fluorescent dye MitoSOX in control cells and cells exposed to uric acid (750 μmol/liter). D, concentration of MitoSOX in mitochondria from control and cells exposed to uric acid. E, percentage of highly polarized mitochondria as determined with the fluoroprobe JC-1. *, p < 0.05; **, p < 0.01; ***, p < 0.001.
FIGURE 4.
Uric acid induces mitochondrial superoxide generation in HepG2 cells by translocating NOX4 to the mitochondria. A, representative confocal image of NOX4 (green) and the mitochondrial marker ACAA2 (red) in control cells (top) and cells exposed to uric acid (750 μmol/liter, bottom). Colocalization is depicted in yellow. B, confocal analysis of ACAA2 and NOX4 colocalization expressed as percentage of NOX4 pixels colocalizing with ACAA2 pixels in control cells and cells exposed to uric acid. C and D, NOX4 protein expression in isolated pure mitochondrial fraction from cells control and exposed to increasing amounts of uric acid. E, superoxide generation from isolated mitochondria from control cells or incubated with uric acid in response to NADPH addition. F, MitoSOX levels in HepG2 cells exposed to uric acid in the presence of the NOX4 inhibitor, apocynin (100 μmol/liter, left panel) or in cells which NOX4 expression has been stably silenced (right panel). G, concentration of TG (milligrams/g of soluble protein) in control and NOX4-deficient cells exposed to fructose or uric acid. *, p < 0.05; **, p < 0.01.
FIGURE 5.
Uric acid induces mitochondrial morphology changes in HepG2 cells. Transmission electron microscopy images at original magnifications of ×15,000 (A and B) and ×60,000 (C and D). Electron microscopy representative images demonstrating marked alterations in mitochondrial morphology in HepG2 cells incubated with 750 μmol/liter uric acid for 24 h. Short and smaller mitochondria was noted in uric acid-treated cells (B, thick arrow) compared with control (A). Higher magnification (×60,000) revealed a significant decrease in number of cristae in disarray and a disruption of mitochondrial double membrane in uric acid-treated cells (D) compared with well preserved cristae (arrowhead, C) and double membrane (thin arrow, C) in control cells. E, quantization of mitochondrial size in control and uric acid-exposed cells (n >100 mitochondria analyzed). **, p < 0.01.
FIGURE 6.
Uric acid stimulates de novo lipogenesis by releasing citrate to the cytosol and activating ACL and FAS. A, mitochondrial activity levels of aconitase in control cells and cells exposed to uric acid. B, mitochondrial activity levels of aconitase in control cells and cells exposed to fructose in the presence or absence of allopurinol. C, cytoplasmic citrate levels (nanomoles/mg of soluble protein) in control cells and cells exposed to uric acid. D–F, expression of activated ACL as determined by its phosphorylation at serine 455 in control cells and cells exposed to uric acid at different time points or fructose in the presence or absence of allopurinol. G, cytoplasmic nonmitochondrial citrate levels (nanomoles/mg of soluble protein) in control and cells exposed to uric acid in the presence or absence of radicicol (10 μmol/liter). H, concentration of TG (milligrams/g of soluble protein) in control and fructose or uric acid-exposed cells in the presence or absence of the ACL inhibitor radicicol. I, concentration of TG (milligrams/g of soluble protein) in control and fructose or uric acid-exposed cells in the presence or absence of the FAS inhibitor C75. *, p < 0.05; **, p < 0.01; ***, p < 0.001.
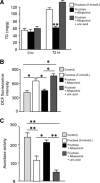
FIGURE 7.
Adding back uric acid (750 μmol/liter) blocks the inhibitory effects of allopurinol (100 μmol/liter) in fructose-induced mitochondrial dysfunction and TG accumulation. A, intracellular TG (milligrams/g of soluble protein) levels in HepG2 cells exposed to fructose alone or in the presence of allopurinol only or along with uric acid. B, DCF fluorescent units in HepG2 cells exposed to fructose alone or in the presence of allopurinol only or along with uric acid. C, mitochondrial aconitase activity in HepG2 cells exposed to fructose alone or in the presence of allopurinol only or along with uric acid. *, p < 0.05; **, p < 0.01.
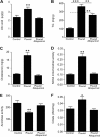
FIGURE 8.
Lowering uric acid prevents hepatic steatosis in the pound mouse. A, quantity of uric acid in liver extracts from lean, pound, and pound with allopurinol mice. B, concentration of TG (milligrams/g of soluble protein) in liver extracts from lean, pound, and pound with allopurinol mice. C, concentration of cholesterol (total and sterol esters) in liver extracts from lean, pound, and pound with allopurinol mice. D, NOX4 mitochondrial activity in liver extracts from lean, pound, and pound with allopurinol mice. E, mitochondrial aconitase activity in liver extracts from lean, pound, and pound with allopurinol mice. F, cytoplasmic citrate in levels liver extracts from lean, pound, and pound with allopurinol mice. (n = 5 for each group.) *, p < 0.05; **, p < 0.01; ***, p < 0.001.
FIGURE 9.
Potential mechanisms whereby uric acid mediates fat accumulation in hepatocytes. Uric acid is a by-product of fructose metabolism generated from the ATP depletion induced by KHK in fructose phosphorylation. AMP is converted to uric acid by the action of several enzymes, including AMP deaminase (AMPD2) and xanthine oxidase (XO). Direct fructose metabolism results in increased TG synthesis by AldoB and fatty-acid synthase (FAS). Similarly, uric acid induces mitochondrial oxidative stress and citrate release to the cytosol for de novo triglyceride synthesis from citrate and acetyl-CoA via ATP citrate lyase (ACL) and FAS.
Similar articles
- Uric acid stimulates fructokinase and accelerates fructose metabolism in the development of fatty liver.
Lanaspa MA, Sanchez-Lozada LG, Cicerchi C, Li N, Roncal-Jimenez CA, Ishimoto T, Le M, Garcia GE, Thomas JB, Rivard CJ, Andres-Hernando A, Hunter B, Schreiner G, Rodriguez-Iturbe B, Sautin YY, Johnson RJ. Lanaspa MA, et al. PLoS One. 2012;7(10):e47948. doi: 10.1371/journal.pone.0047948. Epub 2012 Oct 24. PLoS One. 2012. PMID: 23112875 Free PMC article. - Uric acid activates aldose reductase and the polyol pathway for endogenous fructose and fat production causing development of fatty liver in rats.
Sanchez-Lozada LG, Andres-Hernando A, Garcia-Arroyo FE, Cicerchi C, Li N, Kuwabara M, Roncal-Jimenez CA, Johnson RJ, Lanaspa MA. Sanchez-Lozada LG, et al. J Biol Chem. 2019 Mar 15;294(11):4272-4281. doi: 10.1074/jbc.RA118.006158. Epub 2019 Jan 16. J Biol Chem. 2019. PMID: 30651350 Free PMC article. - Uric acid induces fat accumulation via generation of endoplasmic reticulum stress and SREBP-1c activation in hepatocytes.
Choi YJ, Shin HS, Choi HS, Park JW, Jo I, Oh ES, Lee KY, Lee BH, Johnson RJ, Kang DH. Choi YJ, et al. Lab Invest. 2014 Oct;94(10):1114-25. doi: 10.1038/labinvest.2014.98. Epub 2014 Aug 11. Lab Invest. 2014. PMID: 25111690 - Fructose and sugar: A major mediator of non-alcoholic fatty liver disease.
Jensen T, Abdelmalek MF, Sullivan S, Nadeau KJ, Green M, Roncal C, Nakagawa T, Kuwabara M, Sato Y, Kang DH, Tolan DR, Sanchez-Lozada LG, Rosen HR, Lanaspa MA, Diehl AM, Johnson RJ. Jensen T, et al. J Hepatol. 2018 May;68(5):1063-1075. doi: 10.1016/j.jhep.2018.01.019. Epub 2018 Feb 2. J Hepatol. 2018. PMID: 29408694 Free PMC article. Review. - Sugar, uric acid, and the etiology of diabetes and obesity.
Johnson RJ, Nakagawa T, Sanchez-Lozada LG, Shafiu M, Sundaram S, Le M, Ishimoto T, Sautin YY, Lanaspa MA. Johnson RJ, et al. Diabetes. 2013 Oct;62(10):3307-15. doi: 10.2337/db12-1814. Diabetes. 2013. PMID: 24065788 Free PMC article. Review.
Cited by
- The Causal Effect of Urate Level on Female Infertility: A Mendelian Randomization Study.
Sun J, Shen T, Guan Y, Jiang Y, Xu X. Sun J, et al. Metabolites. 2024 Sep 25;14(10):516. doi: 10.3390/metabo14100516. Metabolites. 2024. PMID: 39452897 Free PMC article. - The role of fructose transporters in diseases linked to excessive fructose intake.
Douard V, Ferraris RP. Douard V, et al. J Physiol. 2013 Jan 15;591(2):401-14. doi: 10.1113/jphysiol.2011.215731. Epub 2012 Nov 5. J Physiol. 2013. PMID: 23129794 Free PMC article. Review. - Dipeptidyl peptidase-4 inhibition ameliorates Western diet-induced hepatic steatosis and insulin resistance through hepatic lipid remodeling and modulation of hepatic mitochondrial function.
Aroor AR, Habibi J, Ford DA, Nistala R, Lastra G, Manrique C, Dunham MM, Ford KD, Thyfault JP, Parks EJ, Sowers JR, Rector RS. Aroor AR, et al. Diabetes. 2015 Jun;64(6):1988-2001. doi: 10.2337/db14-0804. Epub 2015 Jan 20. Diabetes. 2015. PMID: 25605806 Free PMC article. - Longitudinal changes in high sensitivity C-reactive protein associated with serum uric acid in the Korean Genome and Epidemiology Study.
Kityo A, Lee SA. Kityo A, et al. Sci Rep. 2024 Jan 3;14(1):374. doi: 10.1038/s41598-023-50951-2. Sci Rep. 2024. PMID: 38172510 Free PMC article. - Obesity-related cardiorenal disease: the benefits of bariatric surgery.
Fenske W, Athanasiou T, Harling L, Drechsler C, Darzi A, Ashrafian H. Fenske W, et al. Nat Rev Nephrol. 2013 Sep;9(9):539-51. doi: 10.1038/nrneph.2013.145. Epub 2013 Aug 6. Nat Rev Nephrol. 2013. PMID: 23917797 Review.
References
- Adams L. A., Lymp J. F., St Sauver J., Sanderson S. O., Lindor K. D., Feldstein A., Angulo P. (2005) The natural history of nonalcoholic fatty liver disease. A population-based cohort study. Gastroenterology 129, 113–121 - PubMed
- Lim J. S., Mietus-Snyder M., Valente A., Schwarz J. M., Lustig R. H. (2010) The role of fructose in the pathogenesis of NAFLD and the metabolic syndrome. Nat. Rev. Gastroenterol. Hepatol. 7, 251–264 - PubMed
- Abdelmalek M. F., Lazo M., Horska A., Bonekamp S., Lipkin E. W., Balasubramanyan A., Bantle J. P., Johnson R. J., Diehl A. M., Clark J. M. (2012) Higher dietary fructose is associated with impaired hepatic ATP homeostasis in patients with nonalcoholic fatty liver disease. Hepatology 56, 952–960 - PMC - PubMed
- Abdelmalek M. F., Suzuki A., Guy C., Johnson R. J., Diehl A. M. (2007) Fructose-induced hyperuricemia as a causal mechanism for nonalcoholic fatty liver disease. Hepatology 46, 293A (Abstr. 128)
Publication types
MeSH terms
Substances
LinkOut - more resources
Full Text Sources
Other Literature Sources


