MicroRNA-155 promotes atherosclerosis by repressing Bcl6 in macrophages - PubMed (original) (raw)
. 2012 Nov;122(11):4190-202.
doi: 10.1172/JCI61716. Epub 2012 Oct 8.
Yuanyuan Wei, Heidi Noels, Shamima Akhtar, Zhe Zhou, Rory R Koenen, Kathrin Heyll, Felix Gremse, Fabian Kiessling, Jochen Grommes, Christian Weber, Andreas Schober
Affiliations
- PMID: 23041630
- PMCID: PMC3484435
- DOI: 10.1172/JCI61716
MicroRNA-155 promotes atherosclerosis by repressing Bcl6 in macrophages
Maliheh Nazari-Jahantigh et al. J Clin Invest. 2012 Nov.
Abstract
Macrophages in atherosclerotic plaques drive inflammatory responses, degrade lipoproteins, and phagocytose dead cells. MicroRNAs (miRs) control the differentiation and activity of macrophages by regulating the signaling of key transcription factors. However, the functional role of macrophage-related miRs in the immune response during atherogenesis is unknown. Here, we report that miR-155 is specifically expressed in atherosclerotic plaques and proinflammatory macrophages, where it was induced by treatment with mildly oxidized LDL (moxLDL) and IFN-γ. Leukocyte-specific Mir155 deficiency reduced plaque size and number of lesional macrophages after partial carotid ligation in atherosclerotic (Apoe-/-) mice. In macrophages stimulated with moxLDL/IFN-γ in vitro, and in lesional macrophages, loss of Mir155 reduced the expression of the chemokine CCL2, which promotes the recruitment of monocytes to atherosclerotic plaques. Additionally, we found that miR-155 directly repressed expression of BCL6, a transcription factor that attenuates proinflammatory NF-κB signaling. Silencing of Bcl6 in mice harboring Mir155-/- macrophages enhanced plaque formation and CCL2 expression. Taken together, these data demonstrated that miR-155 plays a key role in atherogenic programming of macrophages to sustain and enhance vascular inflammation.
Figures
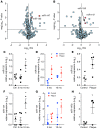
Figure 1. Expression of miR-155 and miR-147 in atherosclerotic lesions and in inflammatory macrophages.
(A) Expression profile of miRs in carotid plaques from Apoe–/– mice 6 weeks after partial ligation in the contralateral carotid artery (n = 6). (B) Expression profile of miRs in LPS- and IFN-γ–stimulated and unstimulated BMDMs (n = 5). (C and F) Expression of miR-155 (C) and miR-147 (F) in the aortic vessel wall of Apoe–/– mice fed regular diet (ctrl) or HFD for 3 or 10 months (n = 3–5 per group). *P < 0.05 vs. ctrl and 3 months. (D and G) Expression of miR-155 (D) and miR-147 (G) in plaque samples laser-microdissected from the aortic root of Apoe–/– mice fed HFD for 3 or 10 months (n = 3–4 per group). The miR expression profile of these plaques was compared with that in samples from arteries without plaques within the same mouse (control). *P < 0.05 vs. control. (E and H) Expression of miR-155 (E) and miR-147b (the human homolog of mouse miR-147; H) in human carotid plaque samples and vessel walls (control). n = 3–4 per group. *P < 0.05. Data represent mean (A and B) or mean ± SEM (C–H).
Figure 2. miR-155 is expressed in macrophages and SMCs in atherosclerotic lesions.
(A) In situ hybridization for miR-155 (red) and immunostaining for galectin-3 (MAC2; green) was performed in murine carotid artery plaques. Arrows denote macrophages expressing miR-155. (B) In situ hybridization for miR-155 (red) and immunostaining for SMA (green) was performed in murine carotid artery plaques. Arrows denote SMCs expressing miR-155. Scale bars: 20 μm.
Figure 3. Role of miR-155 in atherosclerosis.
(A) Lesion area and medial area 6 weeks after partial carotid ligation in Mir155+/+Apoe–/– mice harboring Mir155+/+Apoe–/– or Mir155–/–Apoe–/– BM (Mir155+/+ BM/Mir155+/+ [n = 7] and Mir155–/– BM/Mir155+/+ [n = 8] respectively) and in Mir155–/–Apoe–/– mice harboring Mir155+/+Apoe–/– BM (Mir155+/+ BM/Mir155–/– [n = 6]). Representative images are shown. (B) The number of MAC2+ macrophages in carotid lesions was determined by immunostaining. Representative images are shown. (C–F) Lesional content of SMCs, T cells, neutrophils, and collagen, assessed by immunostaining for SMA (C), CD3 (D), MPO (E), and collagen type I (F). (G) Apoptotic macrophages were quantified in carotid lesions by combined TUNEL staining and MAC2 immunostaining. n = 6–8 mice per group. *P < 0.05. Scale bars: 100 μM. Data are mean ± SEM.
Figure 4. Role of miR-155 in atherogenic macrophage activation.
(A) miR-155 expression by quantitative RT-PCR in murine BM cells cultured in L929-conditioned medium to induce macrophage differentiation. (B) Regulation of miR-155 expression in BMDMs by modified LDL was quantified and compared with classical and alternative macrophage activation by quantitative RT-PCR. (C) Expression of inflammatory macrophage markers was analyzed by quantitative RT-PCR in BMDMs from Mir155+/+ and Mir155–/– mice after stimulation with moxLDL and IFN-γ. (D and E) CCL2 protein in cell lysates (D) and in the cell culture medium (E) of BMDMs from Mir155+/+ and Mir155–/– mice after stimulation with moxLDL and IFN-γ, quantified by ELISA. (F) Migration of Mir155+/+ and Mir155–/– BMDMs across a Transwell filter toward CCL2. (G) Apoptosis of BMDMs from Mir155+/+ and Mir155–/– mice, determined by TUNEL assay. *P < 0.05, ***P < 0.001 vs. all other groups; #P < 0.05 vs. control, oxLDL, IL-4, LPS plus IFN-γ, and moxLDL plus IFN-γ; ‡P <0.05 vs. control, native LDL, moxLDL, oxLDL, and IL-4; §P < 0.05 vs. Mir155+/+. 3 independent experiments were conducted per group. Data are mean ± SEM.
Figure 5. Role of miR-155 in CCL2 expression by lesional macrophages.
Expression of CCL2 (green) was assessed in MAC2+ macrophages (red) from plaques 6 weeks after partial carotid ligation in Apoe–/– mice harboring Mir155+/+Apoe–/– or Mir155–/–Apoe–/– BM and in Mir155–/–Apoe–/– mice harboring Mir155+/+Apoe–/– BM by double immunostaining. Representative overlays of CCL2 and MAC2 immunostaining are shown (top). CCL2 expressed in macrophages is shown in yellow. The percentage of CCL2+ macrophages was determined. Adjacent sections were stained with EVG to demonstrate lesion morphology (bottom). n = 6–8 per group. *P < 0.05. Scale bars: 20 μm. Data are mean ± SEM.
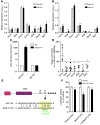
Figure 6. Identification of miR-155 targets in BMDMs.
(A and B) Effect of Mir155 deficiency on expression of potential miR-155 targets Hif1a (n = 4) and Rela, Socs1, Tcf7l2, Bcl6, Pparg, and Sfpi1 (n = 3 for each) in unstimulated (A) and moxLDL- and IFN-γ–stimulated (B) BMDMs. *P < 0.05 vs. Mir155+/+. (C) Quantitative RT-PCR of miR-155 in immunoprecipitates from moxLDL- and IFN-γ–stimulated Mir155+/+ and Mir155–/– BMDMs. Precipitates were obtained after incubation of cell lysates with an anti-EIF2C2 or nonspecific IgG control antibody (n = 4 independent experiments per group). *P < 0.05 vs. IgG. (D) Enrichment of potential miR-155 targets in EIF2C2-IP from moxLDL/IFN-γ–stimulated Mir155+/+ and Mir155–/– BMDMs by quantitative RT-PCR (n = 3–4 independent experiments per group). Results are expressed as target enrichment in Mir155–/– BMDMs normalized to that in Mir155+/+ BMDMs. *P < 0.05 vs. Mir155+/+. (E) Potential target sites for miR-155 in the 3′UTR of murine Bcl6 mRNA, as predicted by the miRanda prediction algorithm (sites A and B; blue). Target site A (sequence highlighted in green) was mutated in the binding region. The same sites in the human Bcl6 3′UTR are also predicted binding sites for human miR-155, differing from mouse miR-155 by 1 nucleotide. (F) Luciferase reporter assays in HEK293 cells treated with miR-155 mimics or nontargeting control mimics using the pEZX-MT01 vector containing the Bcl6 3′UTR or the Bcl6 3′UTR with mutations in predicted miR-155 binding site A (n = 3 independent experiments per group). *P < 0.05 vs. control. Data are mean ± SEM.
Figure 7. Targeting Bcl6 mediates the proinflammatory effects of miR-155.
(A) Effect of siRNA-mediated silencing of Socs1 (si_Socs1_) in Mir155–/– BMDMs on Ccl2 (n = 3) and Tnf (n = 3) mRNA expression was compared with that mediated by nontargeting control siRNA (siNTC) by quantitative RT-PCR. (B and C) CCL2 secretion (B; n = 3) and TNF-α protein expression (C; n = 3) in Mir155–/– BMDMs, compared with that of control siRNA, determined by ELISA. (D) Expression of Ccl2 (n = 3) and Tnf (n = 4) mRNA after siRNA-mediated silencing of Bcl6 (si_Bcl6_) in Mir155–/– BMDMs, compared with that after control siRNA treatment, determined by quantitative RT-PCR. (E and F) Effect of Bcl6 siRNA treatment on CCL2 (E; n = 3) and TNF-α (F; n = 3) protein expression in Mir155–/– BMDMs, compared with that by control siRNA. *P < 0.05 vs. control. Data are mean ± SEM.
Figure 8. Role of NF-κB and TNF-α in regulating CCL2 and BCL6 expression during macrophage stimulation.
(A and B) Role of NF-κB signaling in increased Ccl2 (A) and Tnf (B) mRNA expression in Bcl6 siRNA–treated Mir155–/– BMDMs, as determined using the NF-κB inhibitor BAY11-7085. (C) CCL2 protein levels in the medium of Mir155+/+ BMDMs after stimulation with moxLDL and IFN-γ, quantified by ELISA. A blocking antibody against TNF-α or an isotype control antibody was added to the medium. (D) CCL2 protein levels in the medium of Mir155+/+ or Mir155–/– BMDMs after stimulation with moxLDL and IFN-γ, quantified by ELISA. A blocking antibody against TNF-α (5 μg/ml) was added to the medium in both groups. (E) Effect of moxLDL and IFN-γ stimulation on Bcl6 mRNA expression in Mir155+/+ and Mir155–/– BMDMs. (F) BCL6 protein expression in unstimulated Mir155+/+ and Mir155–/– BMDMs, determined by Western blot. (G) Time course of BCL6 protein expression after moxLDL and IFN-γ stimulation of Mir155+/+ and Mir155–/– BMDMs, determined by Western blot. The intensity of the BCL6 bands relative to that of ACTB bands is expressed as a percentage of that in unstimulated BMBMs (F) or in Mir155+/+ BMDMs 6 hours after stimulation (G). Lanes in G were run on the same gel but were noncontiguous (white lines). (H) Bcl6 mRNA expression in BMDMs stimulated with moxLDL and IFN-γ after treatment with BAY11-7085 or vehicle. *P < 0.05. n = 3 independent experiments per group. Data are mean ± SEM.
Figure 9. Expression of lesional BCL6 is miR-155 dependent.
(A) Combined immunostaining for Bcl6 (red) and MAC2 (green) in atherosclerotic lesions of carotid arteries after partial ligation in Mir155+/+Apoe–/– mice harboring Mir155+/+Apoe–/– or Mir155–/–Apoe–/– BM and in Mir155–/–Apoe–/– mice harboring Mir155+/+Apoe–/– BM. Representative images are shown. Nuclei were counterstained with DAPI (blue). Arrows denote BCL6-expressing macrophages. Scale bars: 50 μm. (B) BCL6+ macrophages in sections of carotid lesions immunostained for BCL6 and MAC2 (n = 6–8 per group). (C) Bcl6 mRNA expression in lesions of carotid arteries 6 weeks after partial ligation in Mir155+/+Apoe–/– mice harboring Mir155+/+Apoe–/– or Mir155–/–Apoe–/– BM, determined by quantitative RT-PCR (n = 4 per group). *P < 0.05. Data are mean ± SEM.
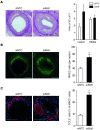
Figure 10. Role of BCL6 in miR-155–mediated atherosclerosis.
Partially ligated carotid arteries from Apoe–/– mice harboring Mir155–/– BM were perivascularly treated with Bcl6 siRNA or nontargeting control siRNA. (A) Lesion area and medial area were determined in carotid artery sections stained with EVG by planimetry. Representative images are shown. (B) Number of macrophages in lesions from the carotid artery, analyzed by immunostaining for MAC2 (green). Representative images are shown, and the number of MAC2+ cells per lesion was determined. (C) Combined immunostaining for CCL2 (green) and MAC2 (red) was performed in carotid artery sections, and the percentage of CCL2+ macrophages (yellow) was quantified. n = 4–5 per group. *P < 0.05. Scale bars: 100 μm. Data are mean ± SEM.
Similar articles
- Regulation of Csf1r and Bcl6 in macrophages mediates the stage-specific effects of microRNA-155 on atherosclerosis.
Wei Y, Zhu M, Corbalán-Campos J, Heyll K, Weber C, Schober A. Wei Y, et al. Arterioscler Thromb Vasc Biol. 2015 Apr;35(4):796-803. doi: 10.1161/ATVBAHA.114.304723. Epub 2015 Feb 19. Arterioscler Thromb Vasc Biol. 2015. PMID: 25810298 - The microRNA-342-5p fosters inflammatory macrophage activation through an Akt1- and microRNA-155-dependent pathway during atherosclerosis.
Wei Y, Nazari-Jahantigh M, Chan L, Zhu M, Heyll K, Corbalán-Campos J, Hartmann P, Thiemann A, Weber C, Schober A. Wei Y, et al. Circulation. 2013 Apr 16;127(15):1609-19. doi: 10.1161/CIRCULATIONAHA.112.000736. Epub 2013 Mar 19. Circulation. 2013. PMID: 23513069 - MicroRNA-155 deficiency results in decreased macrophage inflammation and attenuated atherogenesis in apolipoprotein E-deficient mice.
Du F, Yu F, Wang Y, Hui Y, Carnevale K, Fu M, Lu H, Fan D. Du F, et al. Arterioscler Thromb Vasc Biol. 2014 Apr;34(4):759-67. doi: 10.1161/ATVBAHA.113.302701. Epub 2014 Feb 6. Arterioscler Thromb Vasc Biol. 2014. PMID: 24504735 Free PMC article. - From metabolic to epigenetic: Insight into trained macrophages in atherosclerosis (Review).
Li T, Feng W, Yan W, Wang T. Li T, et al. Mol Med Rep. 2024 Aug;30(2):145. doi: 10.3892/mmr.2024.13269. Epub 2024 Jun 21. Mol Med Rep. 2024. PMID: 38904193 Review. - Potential new therapeutic targets: Association of microRNA with atherosclerotic plaque stability.
Huang P. Huang P. Int J Immunopathol Pharmacol. 2023 Jan-Dec;37:3946320231185657. doi: 10.1177/03946320231185657. Int J Immunopathol Pharmacol. 2023. PMID: 37403558 Free PMC article. Review.
Cited by
- Chemokines and microRNAs in atherosclerosis.
Hartmann P, Schober A, Weber C. Hartmann P, et al. Cell Mol Life Sci. 2015 Sep;72(17):3253-66. doi: 10.1007/s00018-015-1925-z. Epub 2015 May 23. Cell Mol Life Sci. 2015. PMID: 26001902 Free PMC article. Review. - Circulating miR-92a expression level in patients with essential hypertension: a potential marker of atherosclerosis.
Huang Y, Tang S, Ji-Yan C, Huang C, Li J, Cai AP, Feng YQ. Huang Y, et al. J Hum Hypertens. 2017 Mar;31(3):200-205. doi: 10.1038/jhh.2016.66. Epub 2016 Sep 15. J Hum Hypertens. 2017. PMID: 27629245 - MicroRNA-1 prevents high-fat diet-induced endothelial permeability in apoE knock-out mice.
Wang H, Zhu HQ, Wang F, Zhou Q, Gui SY, Wang Y. Wang H, et al. Mol Cell Biochem. 2013 Jun;378(1-2):153-9. doi: 10.1007/s11010-013-1606-x. Epub 2013 Mar 7. Mol Cell Biochem. 2013. PMID: 23467882 Free PMC article. - Small Things Matter: Relevance of MicroRNAs in Cardiovascular Disease.
Peters LJF, Biessen EAL, Hohl M, Weber C, van der Vorst EPC, Santovito D. Peters LJF, et al. Front Physiol. 2020 Jul 7;11:793. doi: 10.3389/fphys.2020.00793. eCollection 2020. Front Physiol. 2020. PMID: 32733281 Free PMC article. Review. - Epigenetic regulation of macrophages: from homeostasis maintenance to host defense.
Chen S, Yang J, Wei Y, Wei X. Chen S, et al. Cell Mol Immunol. 2020 Jan;17(1):36-49. doi: 10.1038/s41423-019-0315-0. Epub 2019 Oct 29. Cell Mol Immunol. 2020. PMID: 31664225 Free PMC article. Review.
References
Publication types
MeSH terms
Substances
LinkOut - more resources
Full Text Sources
Medical
Molecular Biology Databases
Miscellaneous


